Next: Dispersion
Up: Classes
Previous: Classes
Contents
Central Tendency
- There are 3 primary measures of central tendency; each has pros and cons, but all attempt to describe the center point of a distribution of scores.
- Measures of central tendency offer us a ``point'' estimate, or single number, which we can use as a summary of a distribution of scores.
- One number which represents or characterizes the entire distribution (as best as one number can).
- Keep in mind, the center point of scores in a distribution may not be in the middle of the scale of those scores (more on this later).
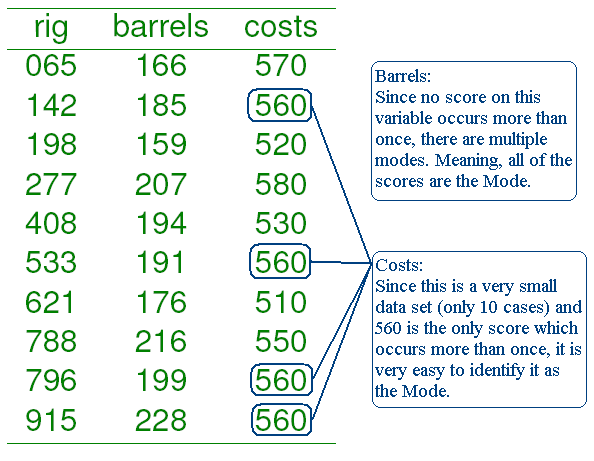
The Mode: symbol = Mo
The mode is the most frequently occurring score in a distribution.
- Commonly used with categorical variables.
- Pro: Easy to compute: simply observe and report the most frequent score(s).
- Pro: Not affected by outliers
- Con: Usually only reflects one actual score1.
- Con: Different samples almost always produce different modes for the same variable.
Oil Sample (n = 10) Example showing the Mode
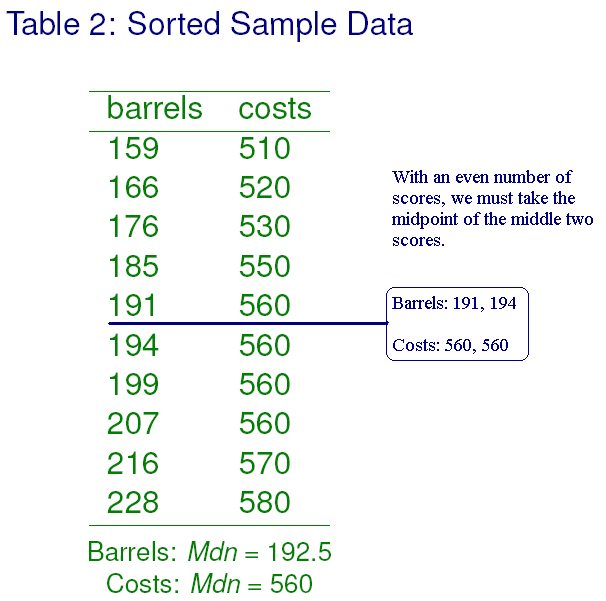
The Median: symbol = Mdn
The median is the ``middle'' score of a distribution.
- More precisely, it is the point that lies in the middle of a distribution.
- Sometimes referred to as the 50th percentile because, there are as many scores above it as there are below it.
- Pro: Not affected by outliers (extreme scores).
- Con: Ignores all but the middle of a distribution.
To calculate the median, first the scores must be arranged in sequential order (e.g., smallest to largest).
- Then;
- For an odd number of scores, the middle score is the Median.
- For an even number of scores, the average of the two middle scores is the median.
Oil Sample (n = 10) Example showing the Median
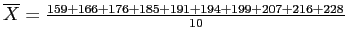
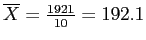
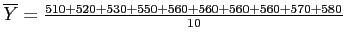
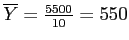
The Mean: sample symbol =  , population symbol =
The mean is the arithmetic average of the scores of a distribution.
- Mean is the most popular measure of central tendency.
- Pro: Generally the best measure of central tendency because, it utilizes all the scores.
- Con: Very sensitive to outliers (extreme scores).
To calculate the sample mean, simply sum all of the scores and divide by the number of scores:
Oil Sample (n = 10) Example showing the Mean
General formula for Mean:
Barrels:
- Barrels:
Costs:
- Costs:
Trimmed Mean & M-estimators
Because mean is very sensitive to outliers, alternatives have been proposed which attempt to correct for this problem.
- Trimmed mean simply refers to a mean calculated after ``trimming'' a certain percentage of extreme scores.
- The median is an extreme example of a trimmed mean; the median trims all but the middle score or middle two scores.
- Common examples are 10% and 20% trimmed means; where the 10 or 20% of the most extreme scores (high & low) are trimmed.
- M-estimators are weighted means; meaning scores near the middle are given more weight and scores at the extremes are given less weight.
Next: Dispersion
Up: Classes
Previous: Classes
Contents
jds0282
2010-10-04