Next: Shape
Up: Classes
Previous: Central Tendency
Contents
Dispersion
Measures of dispersion offer us an idea of how spread out the scores are, or how wide is the distribution of scores.
- There are 5 primary measures of dispersion; 3 of which will be used repeatedly during the rest of this course.
- Range
- Sums of Squares
- Variance
- Standard Deviation
- Coefficient of Variation
- All measures of dispersion must not be zero.
- If a measure of dispersion is zero, then you do not have a variable, you have a constant.
- If our scores are: (5, 5, 5, 5, 5) then dispersion is zero and this is a constant.
The Range
The range is simply the maximum score, minus the minimum score.
Examples from our oil data:
- Barrels:
- Costs:
Disadvantages:
- It is calculated from only 2 scores.
- Those two values are the most extreme in the distribution (obviously sensitive to outliers).
- The range can change dramatically from sample to sample (of the same variable).
- The range is not terribly informative.
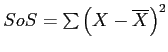
Sums of Squares: symbol = 
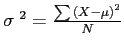
The Sums of Squares are the sum of the squared deviations from the mean for a distribution of scores.
- Though not informative or used as a measure of dispersion, it is very frequently used in the calculation of other statistics.
The general formula for calculating a variable's SoS is:
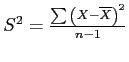
Variance: sample symbol =  , population symbol =
The variance is the average of each score's squared difference from the mean.
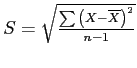
Standard Deviation: sample symbol =  , population symbol =
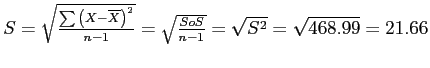
The Standard Deviation is the square root of the variance and allows us to compare the dispersion of one distribution to another.
- It is the most commonly reported measure of dispersion3.
- It is very easy to calculate...just take the square root of the variance.
- Sample Formula:

- Population Formula:

- Note the use of the word ``Standard'' which you will see often; it refers to standardization, which tends to allow us to compare statistics from different variables or distributions (i.e., apples & oranges).
Formula Smormula: Computational formulas vs. Definitional formulas
Computational: designed to make computing by hand easier.
- A matter of opinion these days...
Definitional: designed to make understanding the concept easier, formula follows the definition of the concepts.
- Here are both for the standard deviation of a sample.
Definitional Computational
![\(S = \sqrt{\frac{\sum{X^{2}} - \left[\left(\sum{X}\right)^{2}/n\right]}{n - 1}}\)](img40.png)
- Either can be used; both types provide the same answer.
Calculating using example data (X = barrels)
 |
X |
 |
 |
 |
|---|
|
1 |
159 |
192.1 |
-33.1 |
1095.61 |
|
2 |
166 |
192.1 |
-26.1 |
681.21 |
|
3 |
176 |
192.1 |
-16.1 |
259.21 |
|
4 |
185 |
192.1 |
-7.1 |
50.41 |
|
5 |
191 |
192.1 |
-1.1 |
1.21 |
|
6 |
194 |
192.1 |
1.9 |
3.61 |
|
7 |
199 |
192.1 |
6.9 |
47.61 |
|
8 |
207 |
192.1 |
14.9 |
222.01 |
|
9 |
216 |
192.1 |
23.9 |
571.21 |
|
10 |
228 |
192.1 |
35.9 |
1288.81 |
|
|
 |
 |
 |
 |
Sample mean
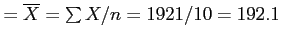
Calculating variance & standard deviation using example data (X = barrels)
Taking the information from the last slide...
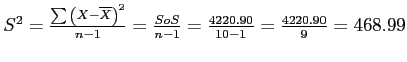
- Sample Variance for `Barrels' is:
- Sample Standard Deviation for `Barrels' is:
Coefficient of Variation
The Coefficient of Variation (CV) is calculated by dividing the standard deviation by the mean, then multiply the result times 100 to express it as a percentage.
The CV allows us to compare the standard deviation of one distribution to another.
CV
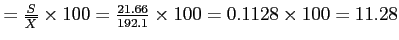
The CV for `Barrels' tells us that the standard deviation is 11.28% of the mean.
In contrast, the CV of `Costs' was 4.11% of the mean; the mean was 550.
- You should be able to work backwards from the information in the lines directly above to get the standard
deviation, variance, & sums of squares for `Costs'.
Next: Shape
Up: Classes
Previous: Central Tendency
Contents
jds0282
2010-10-04
 or
or