


Next: Z-scores
Up: Module 4: Z-scores, Normal
Previous: Contents
Contents
Describing a score in relation to a distribution
- Knowing a score give little information without knowing where it is placed in the distribution.
- Knowing the mean of the distribution allows us to tell if a score is above or below the average.
- An individual scores 26 on a leadership test.
- What does that mean? Are they a good leader or a bad leader?
- If the mean of the test is 20, then we know that the person is above average in leadership (compared to others who have taken the test).
Example 1
- Knowing the standard deviation allows us to tell how much above or below the mean that score is in relations to the spread of the distribution.
- Leadership test:
- The person with the score of 26 is two standard deviations above the mean.
Example 2
- Planning Ability
- A person scores 84 on a test of planning ability.
- If
 , this person's score is 0.5 standard deviations below the mean.
- Thus the person is below average, but not by a lot.
Planning ability:
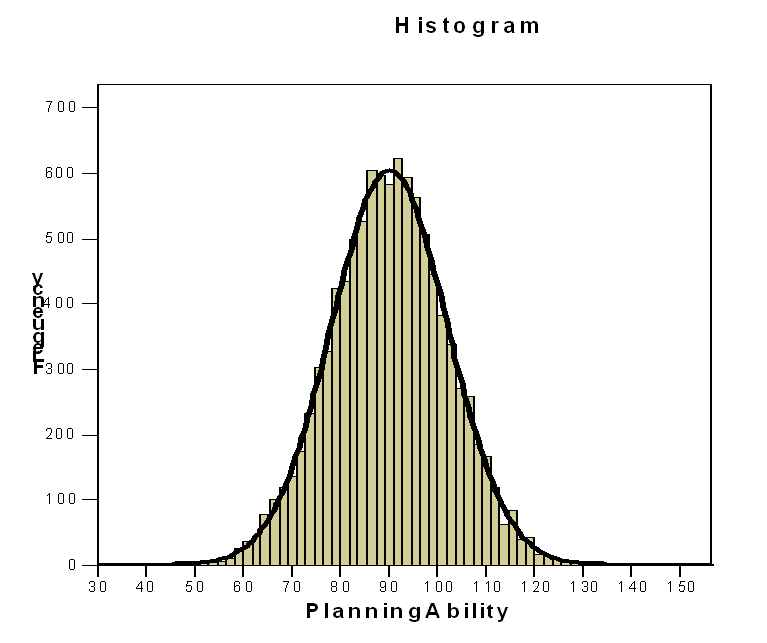
We can visualize that the score of 84 would be slightly lower than the mean.
Examples 3 and 4
- A person scores 114 on the test of planning ability.
- If
, this person's score is 2 standard deviations above the mean.
- Thus the person is above average by quite a bit.
- What if a person scored 78?
- Then the person is below the average by about the average amount that scores deviated from the mean.
- Recall, standard deviation is the average amount the scores deviated from the mean.
Planning ability:
Visualize the score of 114 as far above the mean, while the score of 78 would be slightly below the mean.
Next: Z-scores
Up: Module 4: Z-scores, Normal
Previous: Contents
Contents
jds0282
2010-10-13