


Next: Comparisons
Up: NHST
Previous: Data
Contents
NHST Step 1
- Identify the populations and restate the research question as
 and
and 
- Population 1: UNT undergraduates who are presented words with red font.
- Population 2: UNT undergraduates who are presented words with green font.
- Population 3: UNT undergraduates who are presented words with blue font.
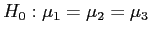
- Null Hypothesis:
- Alternative Hypothesis:
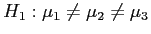
- Note: The Null Hypothesis could be rejected under several conditions.
- Any significant difference among the three means.
NHST Step 2
- Determine the characteristics of the comparison distribution.
- The comparison distribution is the
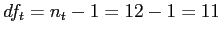
 distribution with 2 and 9 degrees of freedom:
NHST Step 3
- Determine the cutoff sample score on the comparison distribution at which should be rejected.
- Using the distribution with a significance level of 0.05; and 2 (numerator) and 9 (denominator) degrees of freedom:

NHST Step 4
- Determine your sample's score on the comparison distribution.
- Compute your sample statistic(s).
- Calculate
 ,
,  ,
,  , and
, and  for Between groups, Within groups, and Total (as a check of the other calculations) given the information provided above.
Calculate  and
and 
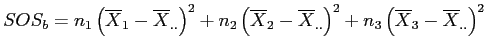
Sum of the  of each group times the squared deviations of each group mean from the grand mean.
![\(SOS_{b} = \sum{\left[n_j\left(\overline{X}_{j} - \overline{X}_{..}\right)^2\right]}\)](img57.png)

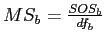
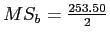
Calculate 
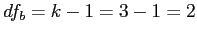
Calculation of Mean-Square between, an estimate of the between groups variance:

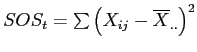
Calculate  and
and 
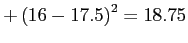
The sum of the squared deviations of each group's score from its group mean (complete calculations available in the handout).
 ...
...
 ...
...
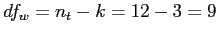
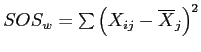
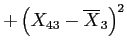
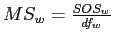
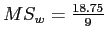
Calculate 
Calculation of Mean-Square within (often called Mean-Square error), an estimate of the within groups variance:
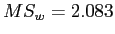
Calculate  and
and 
The sum of the squared deviations of each score from the grand mean (complete calculations available in the handout).
 ...
...
 ...
...
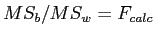
Build the ANOVA Summary Table and Calculate
Table 2: NHST Example ANOVA Summary Table
|
Source |
|
|
|
|
|
Between |
253.50 |
2 |
126.75 |
60.84 |
|
Within |
18.75 |
9 |
2.083 |
|
|
Total |
272.25 |
11 |
|
|
Recall,  and
and
NHST Step 5
Compare and make a decision.
- Decide whether to reject
- Because
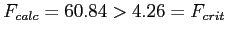
We would reject the null hypothesis and conclude that there was a significant difference among the sample means. This study suggests that there is a difference among the three theoretical populations (each represented by a sample here).
- However, we do not yet know where the significant difference is located, and there may be more than one significant difference among the three groups.
What's next?
- The one-way ANOVA only tells us if there was some significant difference among the groups.
- Two possible ways of identifying where the significant difference(-s) lie.
- Planned Comparisons, which are planned prior to data collection (when designing the study).
- Used to assess specific hypotheses about specific groups (e.g., Red
 Blue; Green
  Blue, etc.).
- Post-hoc testing, which typically compares all possible pair-wise comparisons of the groups.
- Traditionally, only done when the `omnibus' is significant.
- Reality; almost always done to explore pair-wise differences.
Next: Comparisons
Up: NHST
Previous: Data
Contents
jds0282
2010-10-21