|
Module
1. Familiarization with SPSS.
First, we offer a review of
some commonly used terms and definitions.
What is statistics?
There is no generally accepted answer.
"Statistics is considered by some to be a mathematical science
pertaining to the collection, analysis, interpretation or explanation,
and presentation of data, while others consider it to be a branch of
mathematics concerned with collecting and interpreting data. Because of
its empirical roots and its focus on applications, statistics is
usually considered to be a distinct mathematical science rather than a
branch of mathematics" (Wiki).
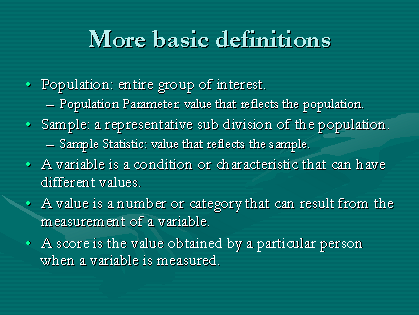
Generally speaking there are
two accepted types of statistics. Descriptive statistics
are used to summarize groups of numbers and make them understandable
(describing the data). Inferential statistics are
used to draw conclusions based on the numbers actually collected during
a research study, but going beyond these numbers (making inferences
about the data and potential data or populations).
Operational
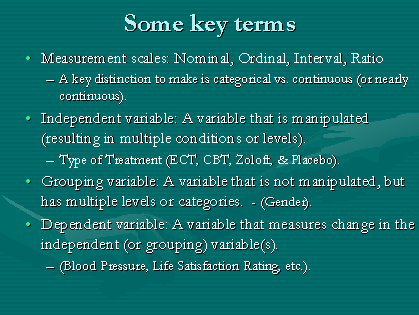
definitions: Operational definitions allow us define
variables with measurement. Think quantitatively. What is the quantity
of this characteristic, phenomena, feature, behavior, emotion, etc.?
Defining a variable operationally means defining it in such a way that
description and observation are not the only benefits, but measurement
as well. How do you define success in college? How do you define
drunkenness? How do you define sadness?
What is PASW / SPSS
and why would we want to use it?
Originally, SPSS was an acronym for Statistical Package for the Social
Sciences. The PASW name was applied when recently IBM bought SPSS. From
this point forward, we will use SPSS to refer to PASW / SPSS.
Regardless of the name or version you use, SPSS is a statistical
software package that allows us to organize, assess, manipulate, and
analyze data. The simple answer for "why would we want to use SPSS" is
that is allows us to do statistical calculations much quicker than by
hand or with other statistical software. This is the only real strength
of SPSS over other packages; its ease of use. SPSS has garnered market
share because the majority of its functions are available as
point-and-click operations, while other software packages require the
user to input syntax, code, or script to perform functions. However,
other software packages have the benefit of newer, more sophisticated
functions available than what is offered in the base SPSS installation.
1.) Creating a data file.
Open SPSS: --> Start,
Programs, SPSS. The initial window (center of the screen) will be
asking you if you want to open an existing file; close that for now by
clicking the "Cancel" button.
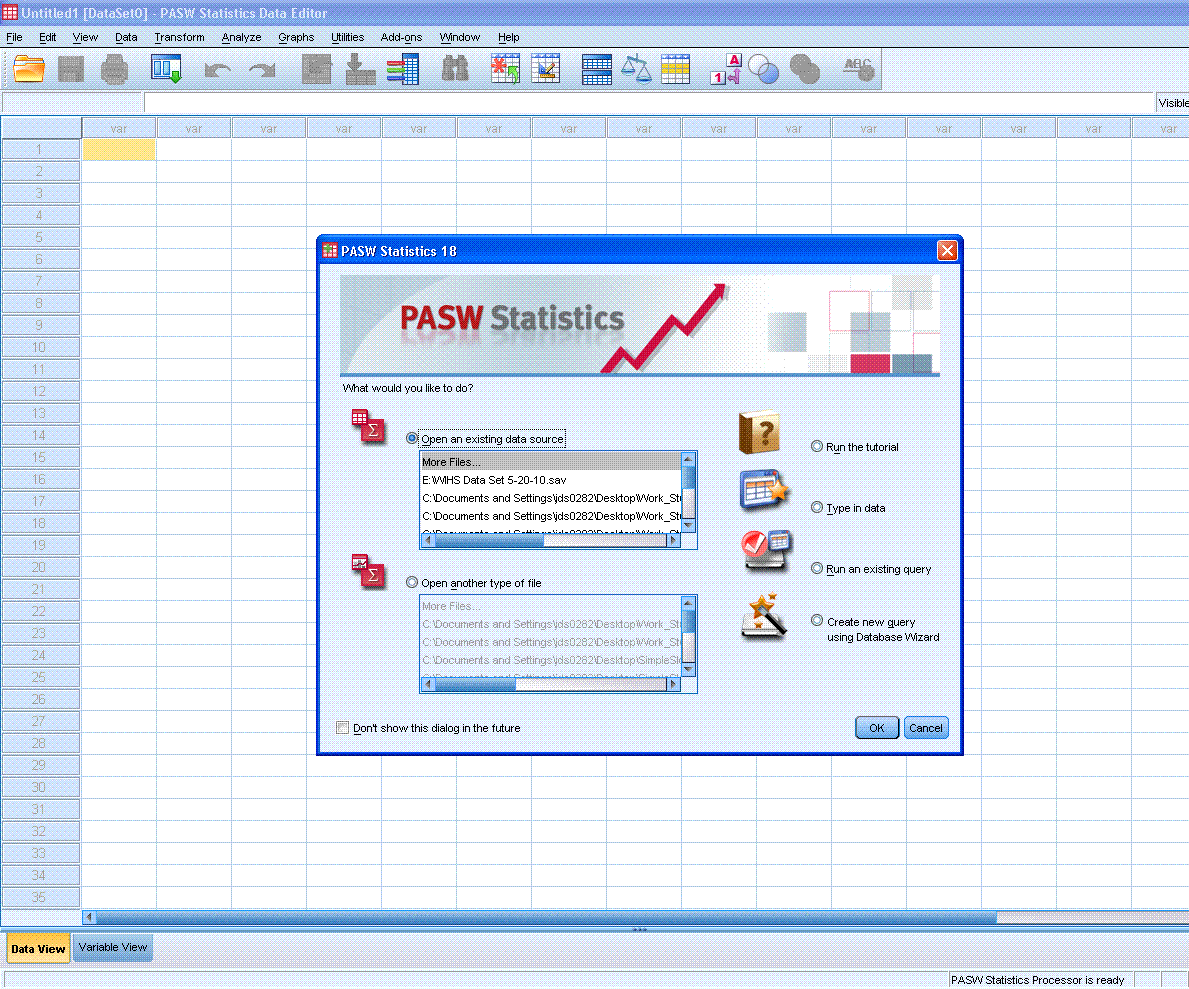
What you will be looking at is
the Data window; one of three windows generally used when working with
SPSS. The other two are the Output window and the Syntax window; both
of which will be discussed below. For now, notice that within the Data
window, each row corresponds to a case or observation and each column
represents a variable. There are two displays of concern within the
Data window; Data View and Variable View, accessed with tabs in the
lower left corner of the Data window.
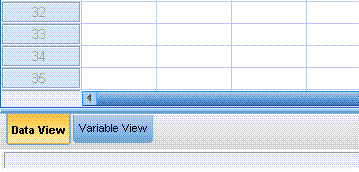
Data View is used to input and
access data. The Variable View is used to specify the details of each
variable in the data file. Click on the Variable View tab. You'll
notice the following details can be specified for each variable. In
Variable View, each row corresponds to a variable and each column
corresponds to some detail or characteristic which can be specified for
each variable.

Name is used to type a short
or abbreviated name of the variable; this will appear as the column
name when in Data View. Type allows you to specify the type of variable
this is (e.g. numeric, string, date, etc.). Width refers to the column
width this variable will have in the Data View. Decimals refers to how
many places to the right of the decimal you would like displayed in
Data View. Label is used to type a description of this variable (i.e.
non-abbreviated). The Label will appear in Data View if one holds his
or her cursor over the Name at the top of the column. Values are used
to assign names to each value of the variable (i.e. what will each
number refer to). Missing allows the user to specify how missing values
are coded for recognition by SPSS. Columns allows the user to specify
more than one column (in Data View) for this variable. Alignment allows
the user to specify the left, center, or right alignment of data within
the column of this variable. Measurement allows the user to specify the
type of variable; here SPSS uses Nominal, Ordinal, and Scale (which
refers to both Interval and Ratio). Role can also be used to specify
the type of variable (input, target, both, none, partition, split).
An example for creating and
setting up a data file.
1. Click on the
Variable View tab at the bottom of the spreadsheet.
2. Click on the first row under Name.
3. Type the word “ID” (this will stand for the Identification number of
each participant).
4. Press <enter>
5. Click on the cell under the Decimals column and type a zero (0).
6. Click on the cell under the Label column.
7. Type “Participant Identification”
8. Click on cell below the Measure column and select Nominal.
9. Click on the Name cell of the next variable.
10. Type “IV” (this will stand for Independent Variable [or
condition]).
11. Press <enter>
12. Click on the cell under the Decimals column and type a zero (0).
13. Click on the cell under the Label column
14. Type “Condition”
15. Click on the Values cell.
16. You will have to click the definition button (…) in the cell. A new
window will open.
17. Type 1 in the Value box, and then click on the Value Label box.
18. Type “Control” and click Add.
19. Repeat steps 17 – 18 using the value “2” and the value label
“Experimental”.
20. Click okay.
21. Click on the cell under Measure, then select Nominal.
22. Click on the Name cell of the next variable.
23. Type “DV” (this will stand for Dependent Variable).
24. Click on the cell under the Decimals column and type a zero (0).
25. Click on the cell under the label column.
26. Type “Number Correct”.
Now,
three variables are defined: the participant number (ID), the levels of
the IV (IV), the number correct on the memory test (DV).

Using
the Data View tab will open the data spreadsheet. It is time to enter
the data. The variable names that were typed under the Name column in
the Variable View should be at the top of the first three columns. In
the Data View, each row represents data for one participant. Data
should be entered under each variable for each participant. To enter
data simply position the cursor in the appropriate cell and type the
number. Pressing the “enter” key will move the highlighted position
down one row. Pressing the “tab” key after entering a value will move
the position over one column to the right. So, the user can either
enter all the values for one variable at a time by using “enter” or all
the variables for one participant can be entered by using “tab.” Now
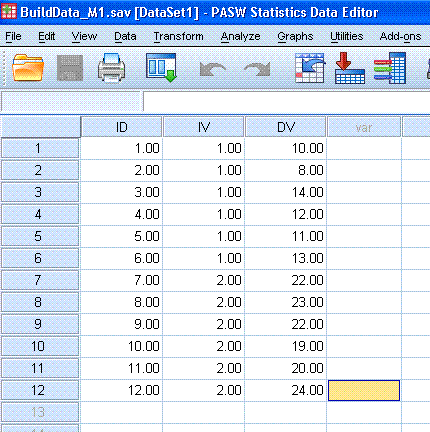
enter the following data for 12 participants with the first 6 in the
control condition and the second 6 in the experimental condition. Their
number correct (from the top): 10, 8, 14, 12, 11, 13, 22, 23, 22, 19,
20, 24.
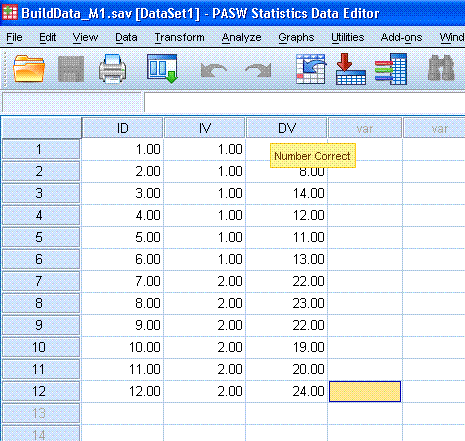
Notice that when you hold the
cursor over the column headings, the Label for that column is
displayed.
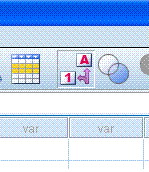
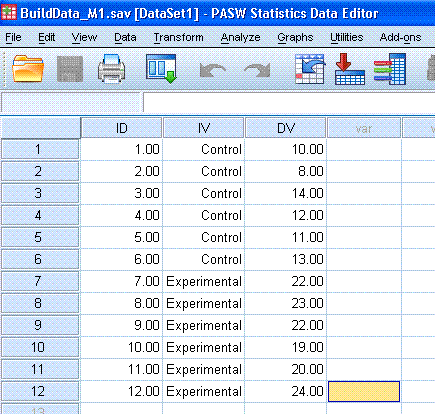
Also notice that when you
click on the Value Labels button (shown below), the Value Labels
(names) are displayed instead of the Values (numbers).
2.) Open an existing data file.
One
of the benefits to newer versions of SPSS is the ability to have
multiple data files open at once.
In
the SPSS tool bar at the top of the Data window, go to File, Open,
Data..., C drive, Program Files.
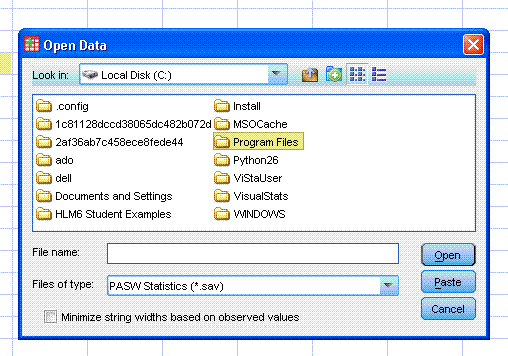
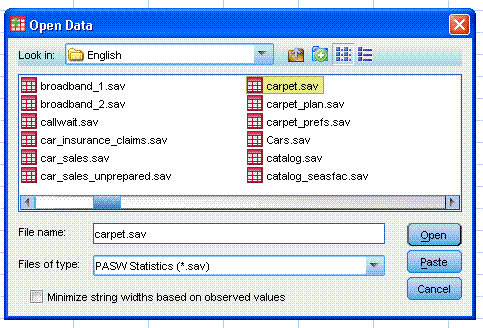
Find
and open the SPSS directory, then open the folder "Samples" then
"English" and notice all the example data sets. Move the slider to the
right and find the "carpet.sav" data file; and open it.
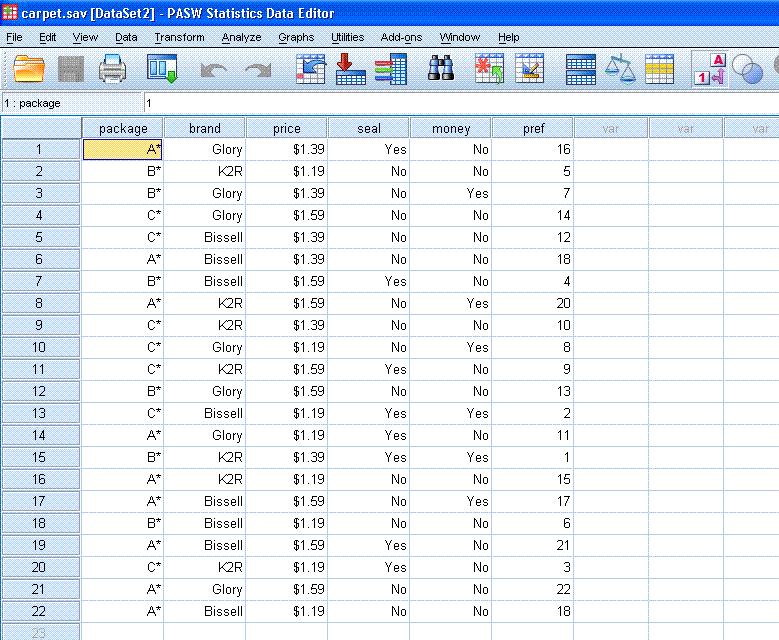
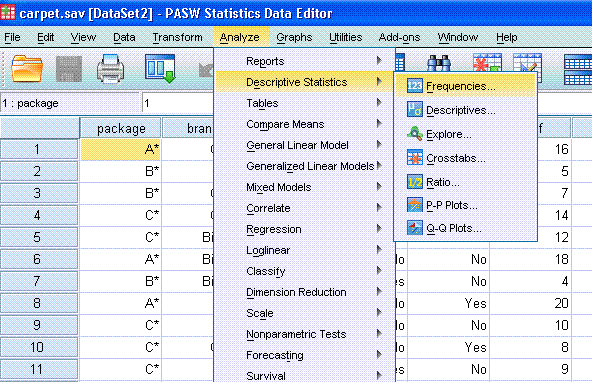
Now,
in the SPSS toolbar at the top of the Data window, go to Analyze,
Descriptive Statistics, Frequencies.
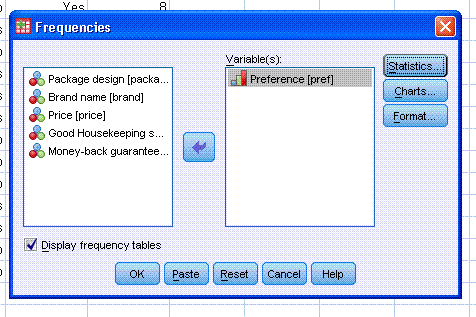
Select
"Preference [pref]" and move it into the variable box; then click the
OK button.
The
output will be displayed in the Output window. The left side of the
Output window shows all the output in outline form, which is often
handy for navigating between many different sections of output. The
right side of the Output window actually displays the tables and
figures of the output and syntax associated with the task performed.
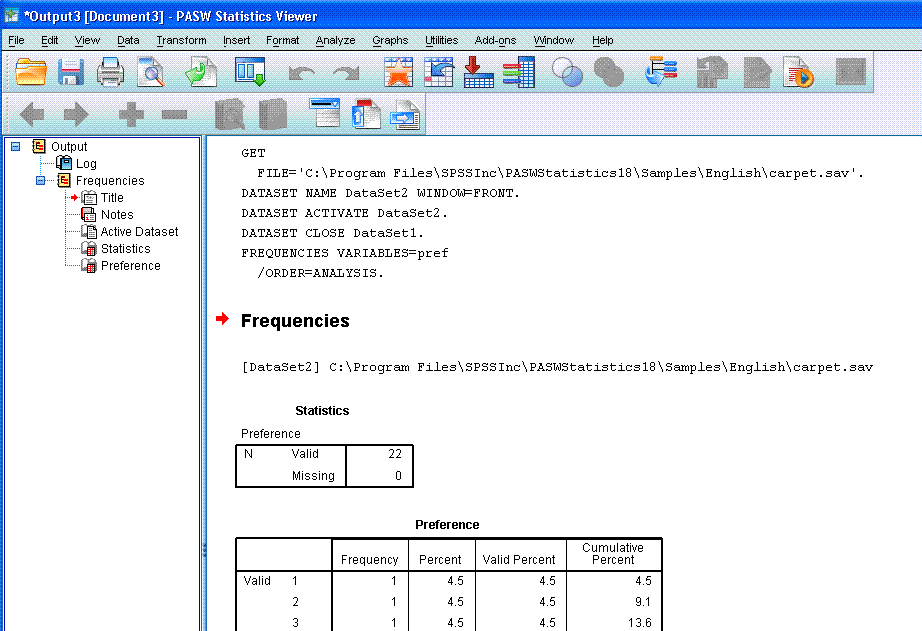
Notice
that in the output, there is a 'Log' section above the primary output
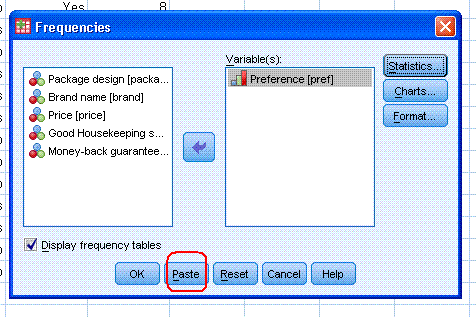
that displays the SPSS syntax. You can create a dedicated syntax file
for each function or analysis you run in SPSS by clicking "Paste"
instead of "OK" in the dialog box for the function or analysis you
specify.
Returning
to the Data window, click on Analyze, Descriptive Statistics,
Frequencies... Notice the last run is still specified. Also
notice that we could have clicked paste--do that now to open the syntax
window.
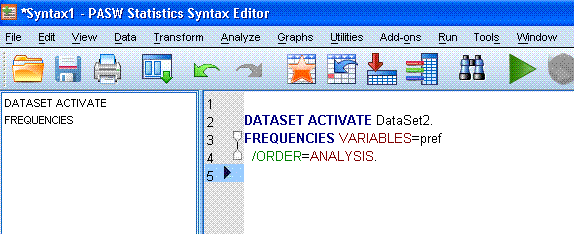
You'll notice the Syntax
window is similar to the Output window in displaying an outline of
tasks on the left and the actual syntax on the right.
Saving
SPSS files is similar to most other programs. Saving data* is done from
the Data window and files carry the .sav extension (e.g. dataname.sav).
Saving output is done from the Output window and files carry the .spv
extension (older versions used the .spo extension). Syntax files are
saved from the Syntax window and carry the .sps file extension.
*As
of PASW Statistics 18, you can now save data in SAS data file format.
|


