|
Recode Recall1
Start off by importing the
ExampleData001.sav
into the Data Editor window; if you have not already done so.
In order to Recode
Recall 1 using quartiles you first must get the quartiles by performing
a simple Frequencies function. In the Data Window, go to Analyze,
Descriptive Statistics, and Frequencies.
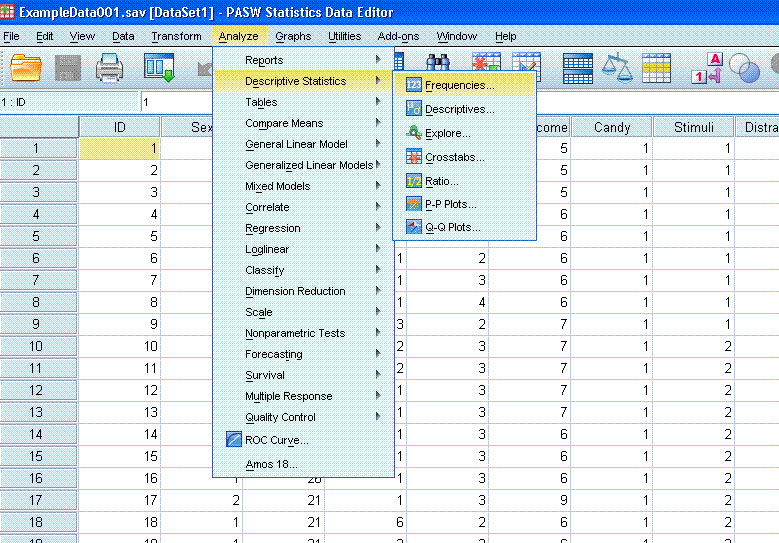
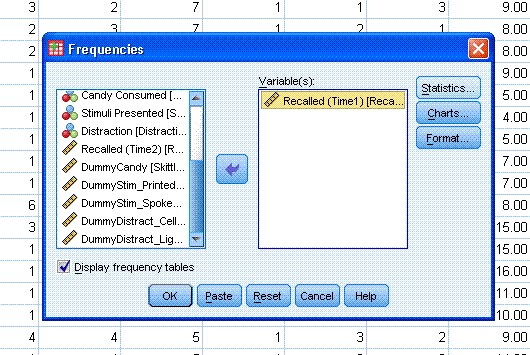
Next, you will be confronted with the Frequencies
dialog box. Move Recalled (Time1) into the 'Variable(s)' box and click
on the 'Statistics...' button.

Once in the Statistics dialog, click to select
'Quartiles' and then click the 'Continue' button. Next, click the 'OK'
button on the Frequencies dialog box.
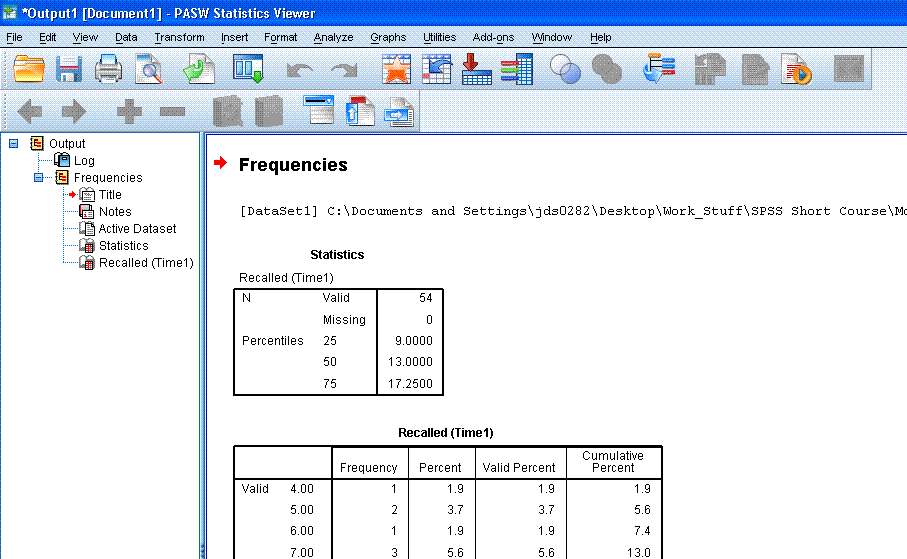
You should now see the output window which should
contain the 'Statistics' table containing the quartiles requested (as
shown above). The key numbers we want are the 25th percentile (9.00),
the 50th percentile (13.00), and the 75th percentile (17.25).
Next, go back to the Data Window and click on
'Transform', then 'Recode into Different Variables'. Again, this will
allow us to preserve the integrity of the original data.
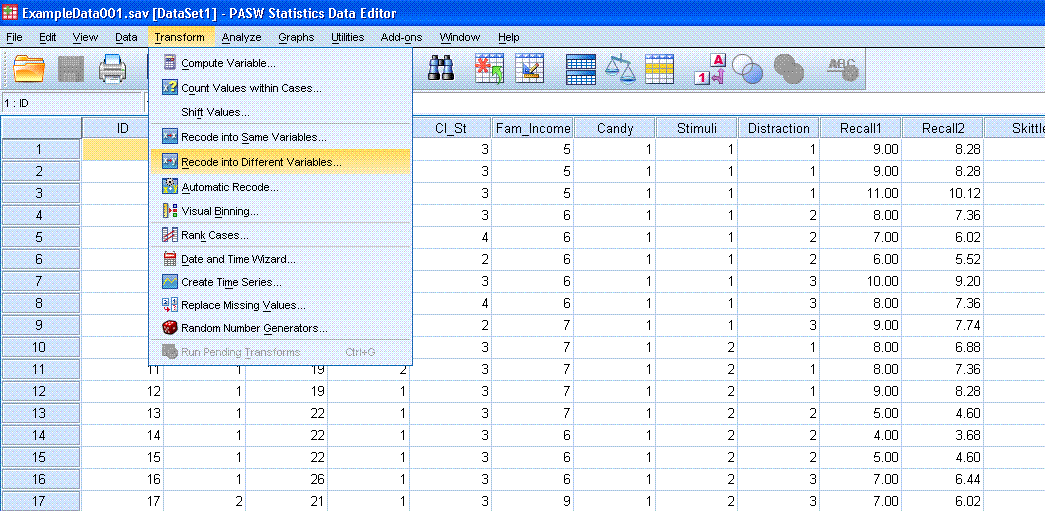
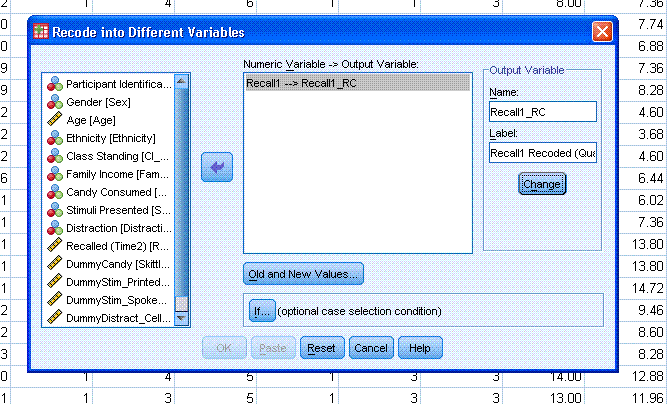
You should now be confronted with the 'Recode into
Different Variables' dialog box. Move Recalled (Time1) into the middle
box using the arrow. Type "Recall1_RC" into the 'Output Variable'
'Name' box and type "Recall1 Recoded (Quartiles)" into the 'Label' box.
Then click on the 'Change' button. Next, click on the 'Old and New
Values' button.
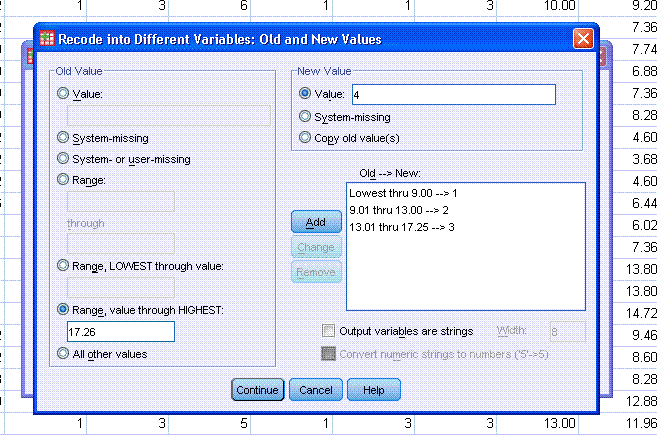
You should now see the old and new values dialog
box. Our goal here is to enter the values for each quartile in such a
way as to recode the raw values of Recall (Time1) into four categories.
(1) Begin by clicking the circle on the left, next
to "Range, LOWEST through value:". Then type 9.00 in the box below
"Range, LOWEST through value:". Then type 1 in the box on the top
right, next to "Value" and then click the "Add" button to add that
specification to the "Old --> New:" box on the lower right.
(2) Next, click on the circle on the left, next to
"Range:" and type 9.01 in the top range box and type 13.00 in the lower
range box (below "through"). Then type a 2 in the "Value" box on the
right. Then click the "Add" button.
(3) Next, click on the circle on the left, next to
"Range:" again. Type 13.01 in the top range box and type 17.25 in the
lower range box (below "through"). Then type a 3 in the "Value" box on
the right and click the "Add" button.
(4) Next, click on the circle on the left, next to
"Range, value through HIGHEST:". Then type 17.26 in the box below
"Range, value through HIGHEST:". Then type a 4 in the "Value" box on
the upper right and click the "Add" button.
Next, click the "Continue" button, then click the
"OK" button on the 'Recode into Different Variables' dialog box.
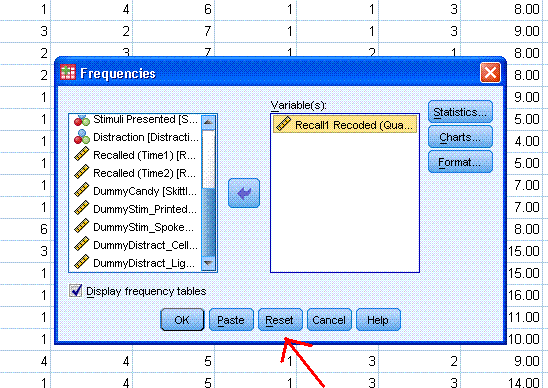
Next, to make sure we got what we wanted, go to
Analyze, Descriptive Statistics, Frequencies.

Once in the Frequencies dialog box, Click the reset button
which will remove the previous variable(s) and other optional
selections. Then move Recall1 Recoded to the "Variable(s)" box. Next,
click the "OK" button.
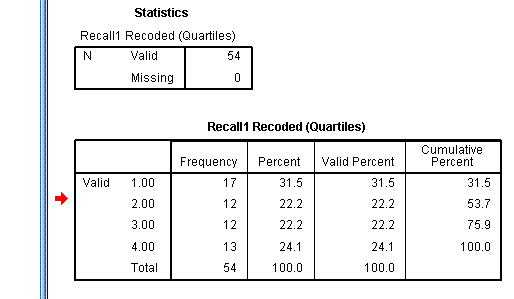
You should see a table like the following in your
output, which contains the four new groups according to quartiles (e.g.
1 = 25th quartile, 2 = 50th, etc.).
That concludes the recoding of Recode Recall 1 using quartiles.
|


