|
Restructure Data
The Restructure function is often useful when
dealing with data which is in
Long format and one needs the data in Wide format,
or vice versus. Long format refers to data in which each observation or
participant has multiple rows. Wide format refers to data in which each
observation or participant has only one row. This tutorial will focus
on using the restructure function to change data from long format to
wide format. Longitudinal research is an example of the type of
research which often creates data files in long format.
For the duration of this tutorial we will be using
the
LongExample.sav
file; which contains 10 participants measured on 3 outcome variables
under 10 different conditions. This data was generated using
this
script in R.
Begin by importing the above data file (LongExample.sav)
and briefly examine the data.
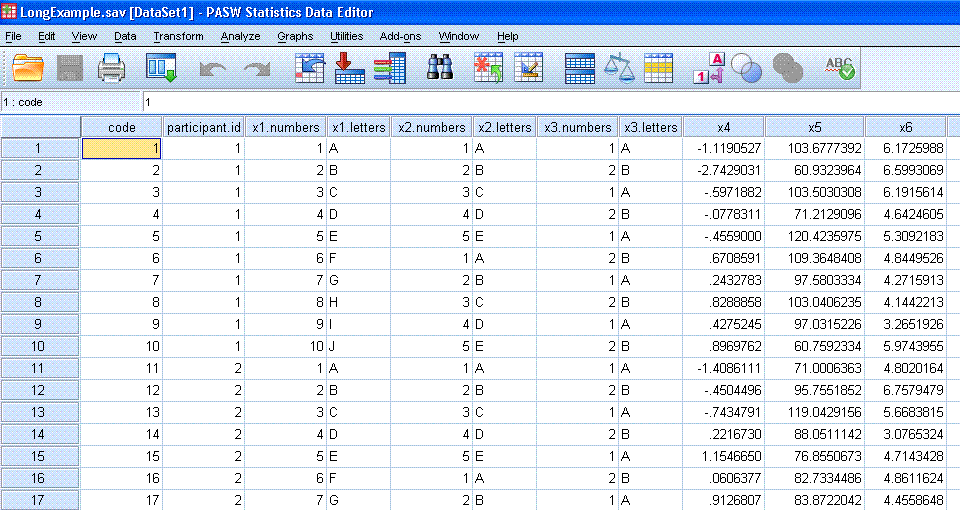
Notice, we have a 'code' variable which simply
assigns a sequential number to each row of data. Then, there is a
'participant.id' variable in which each number represents a participant
(or case, or observation). Next, we have a series of categorical
variables which each identify a condition of our study. The first two
such variables, 'x1.numbers' and 'x1.letters' can be thought of as
identifying the 10 different times of measurement using either numbers
or letters respectively as identifiers. The next two variables
('x2.numbers' & 'x2.letters') can be thought of as representing
5 different conditions of our study (e.g. 5 different therapy types, 5
different treatment drugs, 5 different locations, etc.). The next two
variables ('x3.numbers' & 'x3.letters') can be thought of as
representing 2 different conditions of our study, similar to the x2
variables; but with only two levels. The final three variables are our
interval / ratio outcome variables.
So, currently there are 100 rows of data with 10
participants, each measured 10 different times and at each time of
measure they were exposed to a unique set of x2 and x3 conditions and
measured with three instruments.
Our goal here is to use the Restructure function
to transform the format of the data file from its current Long format
(each participant has 10 rows), to a short format (where each
participant has one row) while still retaining all
the information contained in the original data file.
Start by clicking on Data in the tool bar. Next,
click on Restructure...
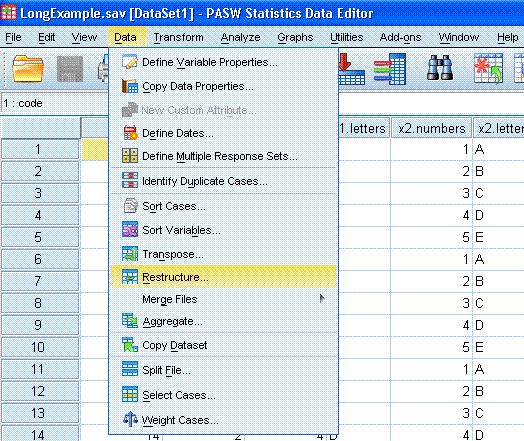
Next, select "Restructure selected cases into
variables" option which is emphasized with a red
ellipse here. Then click the Next > button.

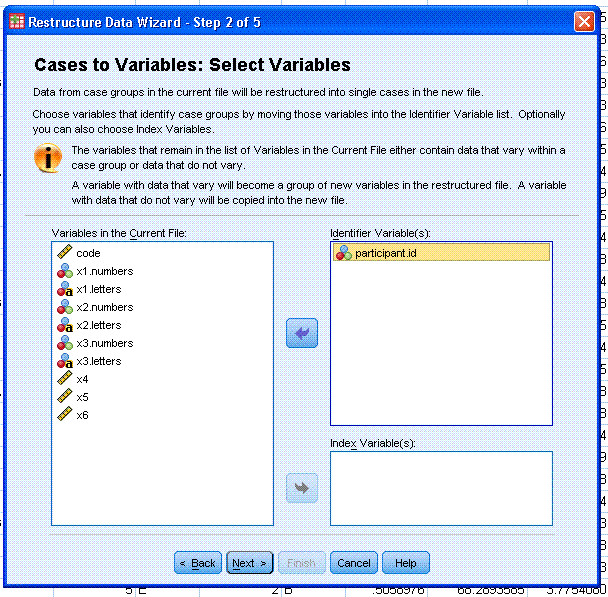
Step 2; highlight / select the participant.id
variable and use the top arrow button to move it to the Identifier
Variable(s): box. Then click the Next > button.
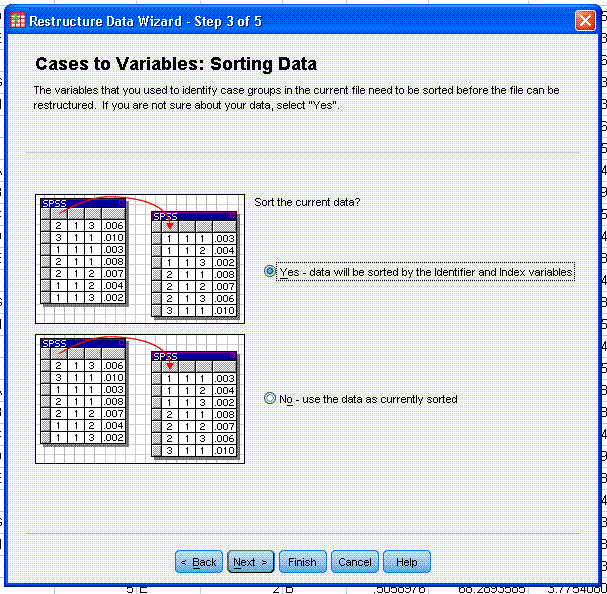
Step 3; we do not need to
change the Sort option; we can allow SPSS to sort the data by the
identifier -- which will list each participant sequentially from 1 to
10 as rows in our new data file. Click the Next > button to
continue.
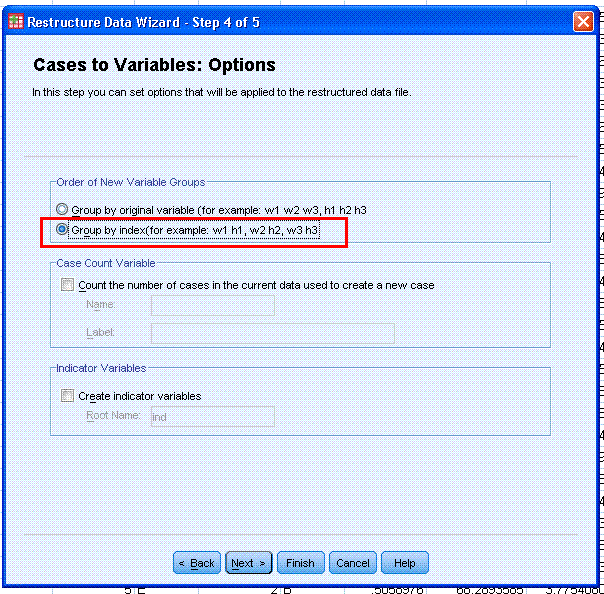
Step 4; select "Group by index(for example: w1 h1,
w2 h2, w3 h3" which is emphasized here with a red
rectangle. This option will allow us to keep each unique
combination of x1, x2, x3 conditions' outcome scores separated from
each group of outcome scores associated with every other unique
combination of x1, x2, x3 conditions. Click the Next > button to
continue.
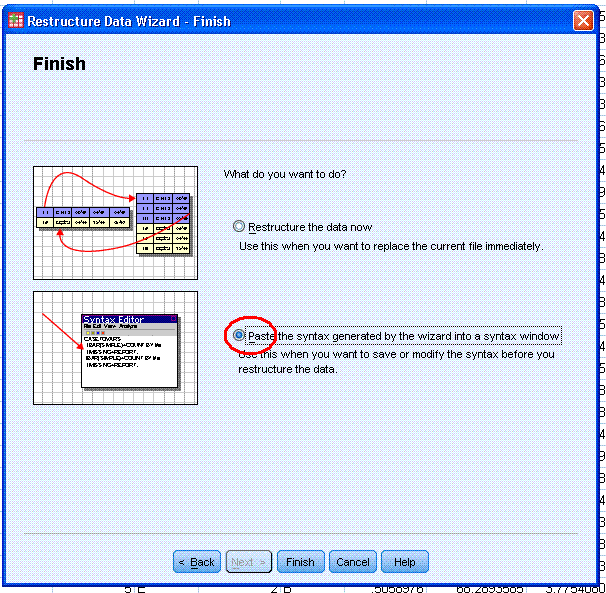
Lastly, select the "Paste the syntax generated by
the wizard into a syntax window" option which is emphasized here with a
red ellipse.
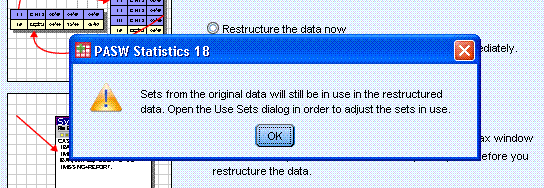
After selecting the paste option, click the Finish button and a warning
box will appear to let you know the sets (data sets) will still be
available in after restructuring has taken place.
 Click the OK button and a syntax window will open with the generated
syntax in it.
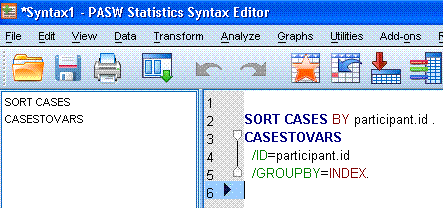
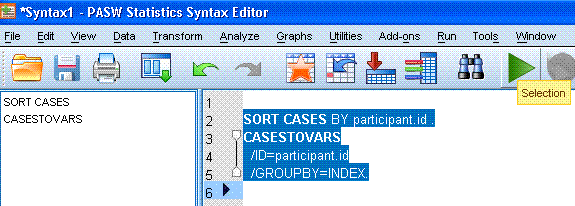
In the syntax window, highlight all the text and
then click on the run Selection button
 to run the syntax. Below
right; the word Selection has appeared because the cursor is being held
over the run Selection button. to run the syntax. Below
right; the word Selection has appeared because the cursor is being held
over the run Selection button.
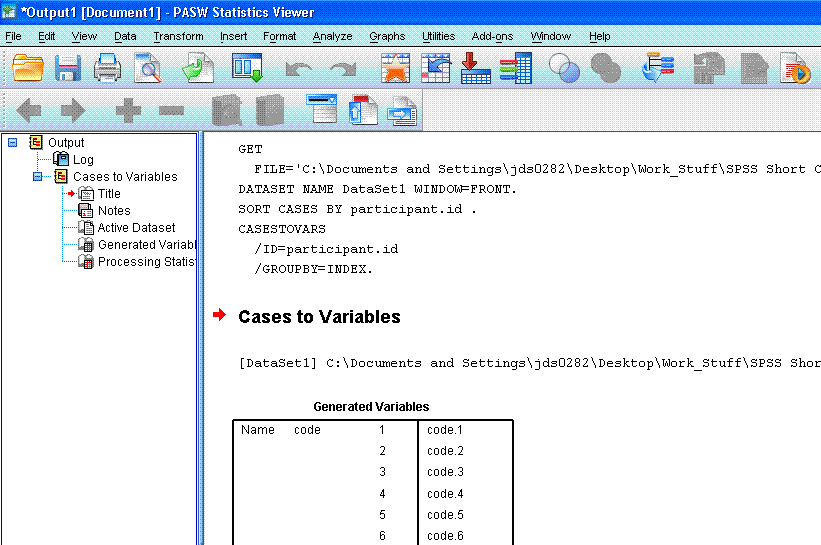
Once the function runs, the output window will
open (if not already open) and it will contain some trivial output
showing which variables were generated (really which variables were
transposed) and it will show a Processing Statistics table which
displays the number of cases in and out, number of variables in and
out, and the number of index variables.
The new data file should resemble what is below.
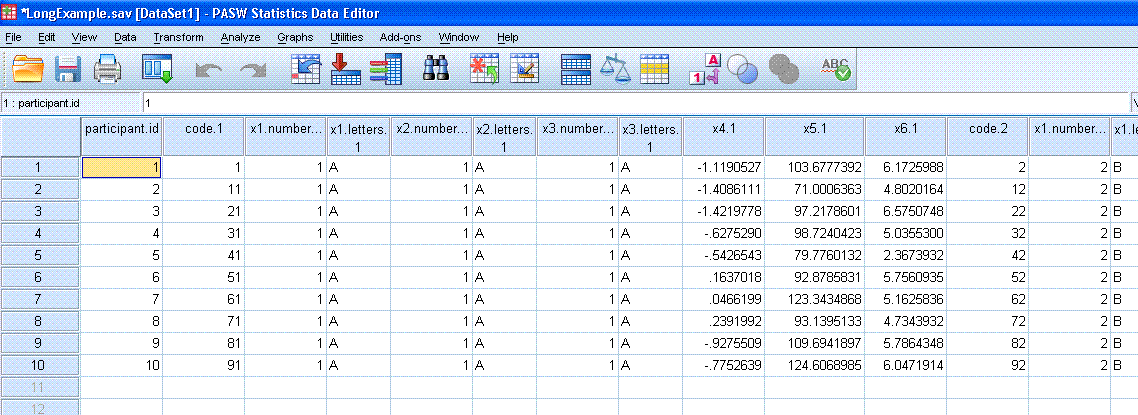
Each row in the new data file corresponds to a
single participant because we used the participant.id variable as our
identifier variable. The participant.id variable is the only column
which was not changed or re-named in the restructuring. The code
variable from the original data has now been broken down into ten
columns and servers as a marker in the new data file; marking each of
the 10 segments or chunks of data. By segment or chunk, we mean each
time of measure. The x1.number and x1.letters variables also serve this
function; identifying each of the ten times of measure. Each segment
contains the unique combination of x1, x2, x3 identifiers and a unique
score on x4, x5, x6 for each participant. Sliding the cursor to the
right (in the data window of SPSS) you'll notice each time of measure,
or chunk; identified by the sequential numbers and letters (chunks from
left to right, 1 to 10 & A to J) in the columns associated with
the x1 variables. You will also notice in each chunk a unique
identifier for each of the x2 (1 to 5 & A to E) and x3 (1 to 2
& A to B) variables. Each also chunk contains scores (for each
participant) on the three outcome measures (x4, x5, x6). Having the
data in this format allows us to run repeated measures analysis and/or
compute total scores for each or any unique combination of conditions.
As is the case with all of the tutorials on this
web site, this tutorial should not be considered an exhaustive review
of the topic covered; restructure data from long to wide format.
Restructuring data from wide to long can be done by using similar
steps; simply choose "Restructure selected variables into cases" at the
initial Restructure Data Wizard dialog and follow the steps of the
wizard.
|


