|
Canonical
Correlation in SPSS 18.
Many analyses are available in the Analyze menu
from simple correlations to multivariate design BUT; some are only
available through the use of syntax.
Canonical correlation is one such analysis; it is
only available through syntax if you want to save values associated
with it (e.g. canonical scores). A good reference for this stuff can be
found
here.
First, import the
CCdata.sav
file.
Next, open a new syntax window by going through
File, New, Syntax.
Next, you will need to find a particular file
called "Canonical correlation.sps". This file should
be located inside the English directory, which itself is inside the
Samples directory of your PASW/SPSS installation. Notice the file path
in the syntax below. With the new syntax window open, you will need to
type the following syntax. Pay particular attention to the periods at
the end of the first line and the third line of syntax. Also note; the
variable names are in lower case in lines 2 and 3 of the syntax.

It is important to note at the outset; when the
cancorr function is run, it will alter the existing data set by saving
canonical scores as new variables to the right of any existing
variables in the data set.
You can now highlight all three lines of the
syntax and then click on the big green (run selection) arrow / triangle
in the tool bar.


Once you submit the syntax and it runs properly,
you should be looking at the new (altered) data file which is
noticeable because of the new variables listed to the right of the
original variables.
The top / beginning of the output should look
similar to that displayed below. Note that most of the output is simply
text. Also note that here there were 3 canonical solutions. Generally,
the first canonical solution is the best. Notice the actual canonical
correlation for the first solution located at the top, inside the red ellipse (rc
= .353). Of course, this would not be the only
statistic interpreted or reported with canonical correlation. The
remaining output provides all the standardized and raw loadings and
coefficients, as well as the variate correlations that are necessary
parts of interpreting a canonical solution.

In general, it would be fair to say our
personality composite accounts for only 12.46 % of the variance in our
engagement composite (.353 * .353 = .1246). Again, this would not
be the only statistic interpreted or reported.
Canonical
Correlation in IBM SPSS 20.
First, download the example
data
file and open it in IBM SPSS 20. The file contains 500 rows
and 8 variables (x1, x2, x3, x4, y1, y2, y3, y4).

Next, download and open the example
syntax
file which contains the necessary MACRO for doing canonical
correlation. Once you download the syntax file, you can go to File,
Open, Syntax... in the SPSS menus.

When you open the syntax file, it should look
similar to what is below.
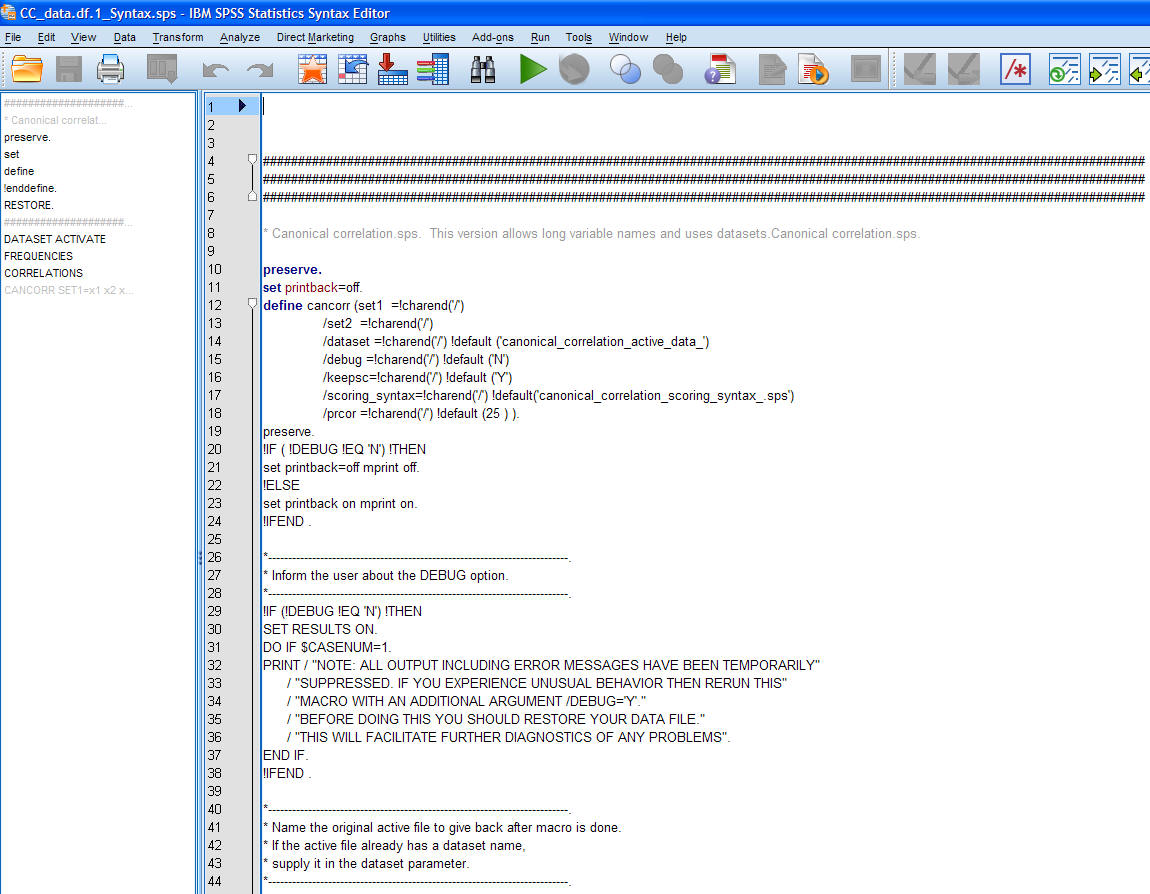
Notice, the syntax for the
Matrix operation is very long (i.e. the image above only shows the
first 44 lines of the 450 or so lines).
Next, you need to run or read-in the MACRO;
essentially, highlight lines 10 through 443 and then click the 'run'
button 
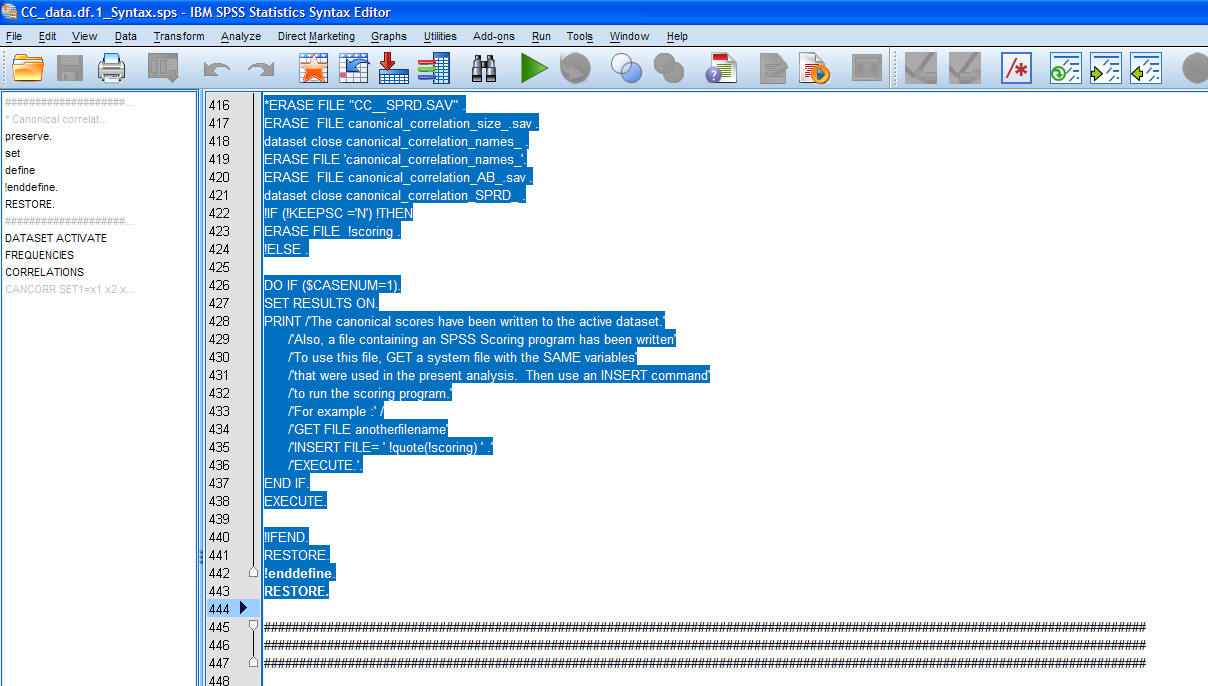
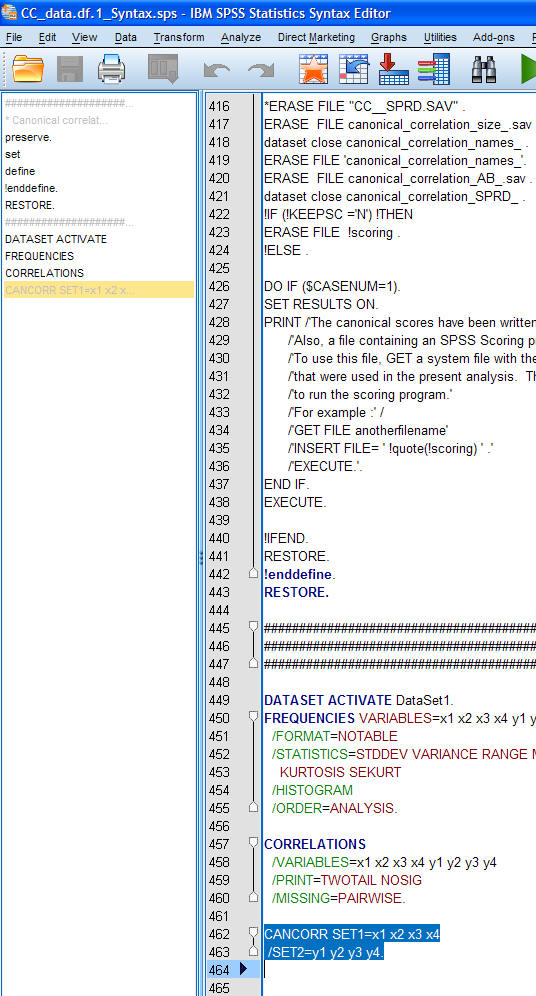
Once the MACRO has been read-in, you can then use
the syntax to run the canonical correlation (i.e. the highlighted
syntax in the image below).
The resulting output will look a little different
than what you would expect from SPSS (i.e., most of the Matrix output
is text rather than tables and graphs). Part of the resulting output is
displayed below:
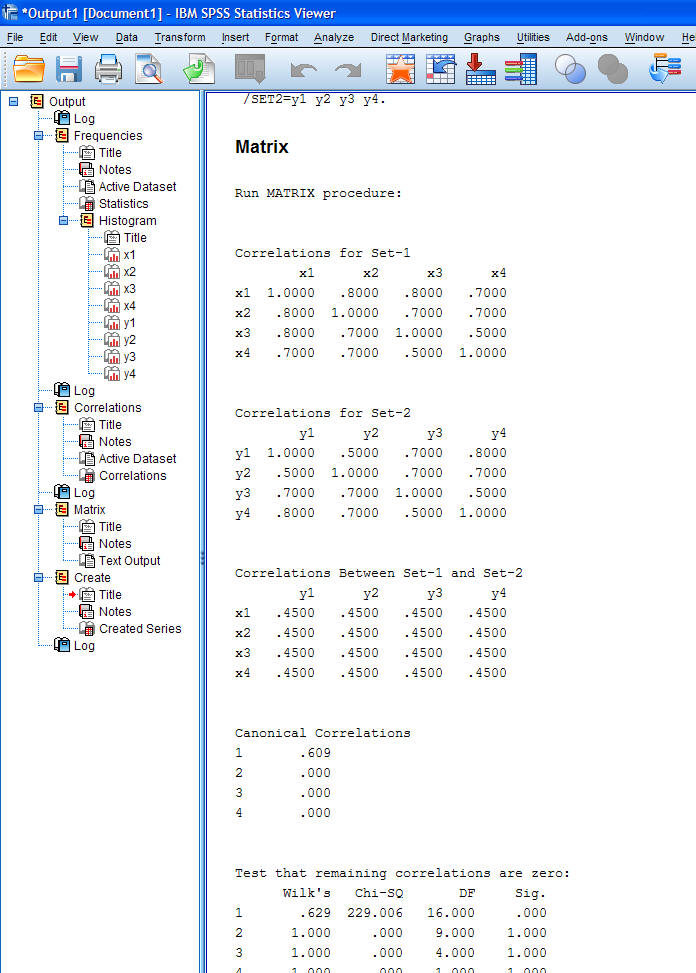
Notice the first canonical solution provides a
canonical correlation coefficient of 0.609. As mentioned in the
previous example, this would *not* be the only statistic reported.
Reference:
Clark, M. J. (2006). Canonical correlation with SPSS.
Benchmarks Online: RSS Matters, 01/2006.
(Available
here)
|