|
Internal Consistency (IC)
Often when one is conducting principal components
analysis or factor analysis, one will want to conduct an analysis of
internal consistency (IC). Traditionally, reliability analysis was used
synonymously with internal consistency and/or Cronbach's Alpha or
Coefficient Alpha. Cronbach's Alpha is not a statistical measure of
reliability; it is a measure of internal consistency, or more
accurately, Cronbach's Alpha is a measure of homogeneity. Reliability
in general refers to whether or not a measurement device provides
consistent results across multiple administrations with either the same
subjects/participants at different times of measure or with differing
subjects/participants with known quantities of the characteristic being
measured. Internal consistency can be thought of as the relationship
between each item and each other item; and internal
consistency can be thought of the relationship of each item to the
collection of items or total score. Reliability can be assessed in two
ways: (1) by correlating multiple administrations of the measurement
device given to the same population at different times -- this is known
as test-retest reliability; where, the higher the correlation the more
reliable the device is said to be and (2) correlating the scores on an
established measure to the new (being evaluated) measure; of different
groups of individuals with known quantities of the characteristic being
measured. Internal consistency is assessed using (1) the item to total
score correlation and (2) Cronbach's alpha coefficient.
Internal
Consistency in SPSS.
For the duration of this tutorial we will be using
the
ExampleData4.sav
file.
IC 1.
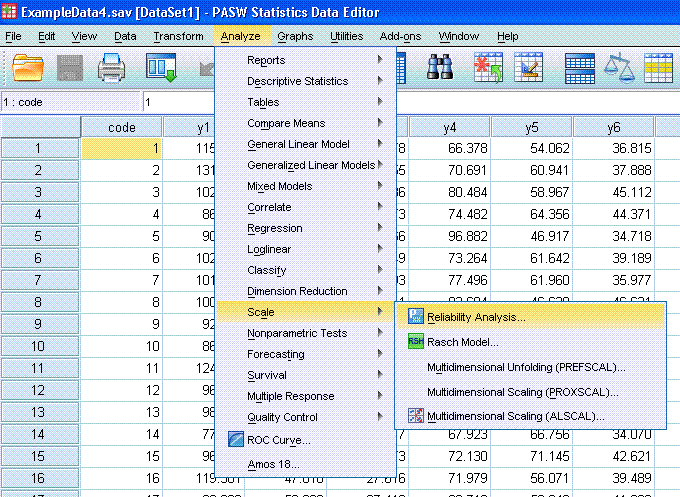
Begin by clicking on Analyze, Scale, Reliability Analysis...
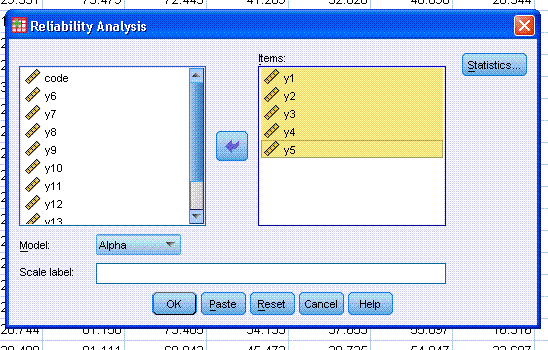
Next, highlight items y1 through y5; notice you
can assign a Scale label; and select other models of analysis (i.e.
Split-half, Guttman, Parallel). Next, click on the Statistics button.
Next, select the following: Item, Scale, Scale if
item deleted, and Correlations. Then click the Continue button and then
click the OK button.

The output should be similar to what is displayed
below. The first four tables are intuitively named and report number of
observations/cases, Cronbach's alpha, descriptive statistics, and
inter-item correlations.

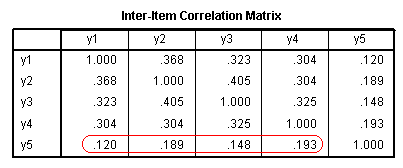
Here we see one reason for the slightly lower
than expected alpha, item y5 does not correlated well with the other
items (here marked with a red ellipse).
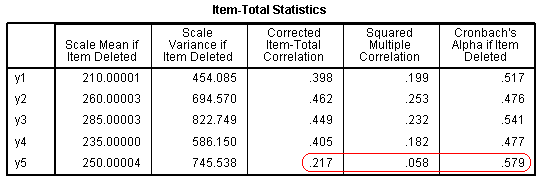
Looking at the item-to-total score correlations
(3rd column), we see further evidence that y5 is not contributing to
the internal consistency of our scale; it is not correlated well with
the total score (here marked with the red ellipse). Item y5 only
accounts for 5.8% of the variance in total scores--quite low indeed.
Lastly, we see that if we delete item y5, our alpha coefficient will
increase -- a strong sight the item should be removed from the scale.
Notice, the other items all display a decrease in alpha if they were to
be removed from the scale--indicating the importance of their
contribution.
 Lastly, we see the total
score descriptive statistics. Lastly, we see the total
score descriptive statistics.
Here, we see our un-named scale's internal
consistency (Cronbach's
α = .577) was slightly lower than we would like to see. Generally,
0.70 is acceptable, 0.80 is good, and 0.90 or higher is considered very
good. However, as with all rules of thumb, established literature
should be consulted prior to passing judgment on the adequacy of a
statistic.
So, the general interpretation for these 5 items
indicates, our scale would be more internally consistent if we were to
remove item y5.
IC 2.
Returning to the Data Window, click on Analyze, Scale, Reliability
Analysis...

You'll notice the previous run is still specified;
therefore, simply remove item y5 from the Items: box, then click on the
OK button.
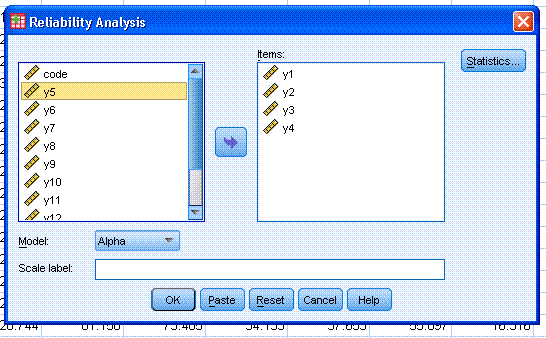
The output should be similar to what is displayed
below.

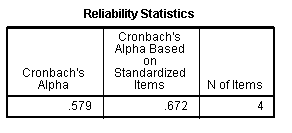
As was suggested above, without item y5, the
internal consistency coefficient has increased (Cronbach's α = .579). It is still
not terribly high, but better.
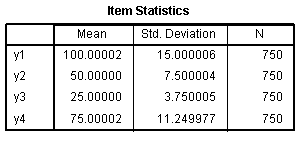
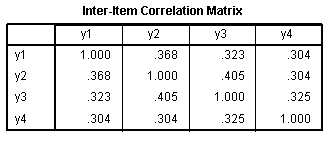
As would be expected, the inter-item
correlations have not changed, but all are relatively similar.

Here, we see that all the items display
substantial correlations with the item total score and each displays a
decrease in internal consistency if they were to be deleted.

Here, we see the revised Scale (total score)
descriptive statistics. Of particular interest is the variance. Compare
the variance of this 'revised' scale (745.538) to the variance of our
'initial' scale in the first run (933.406); decreased total score
variance indicates greater internal consistency.
|


