|
If you are not familiar with
Bivariate
Regression or
standard
Multiple
Regression, then I strongly recommend returning
to those previous tutorials and reviewing them prior to reviewing this
tutorial.
Multiple
Linear Regression
while evaluating the influence of a covariate.
Multiple regression simply refers to a regression
model with multiple predictor variables. Multiple regression, like any
regression analysis, can have a couple of different purposes.
Regression can be used for prediction or determining variable
importance, meaning how are two or more variables related in the
context of a model. There are a vast number of types and ways to
conduct regression. This tutorial will focus exclusively on ordinary
least squares (OLS) linear regression. As with many of the tutorials on
this web site, this page should not be considered a replacement for a
good textbook, such as:
Pedhazur, E. J. (1997). Multiple
regression in behavioral research: Explanation and prediction
(3rd ed.). New York: Harcourt Brace.
For the duration of this tutorial, we will be
using
RegData001.sav
Standard Multiple Regression. Standard
multiple regression is perhaps one of the most popular
statistical analysis. It is extremely flexible and allows the
researcher to investigate multiple variable relationships in a single
analysis context. The general interpretation of
multiple regression involves: (1) whether or not the regression model
is meaningful, (2) which variables contribute meaningfully to the
model. The first part is concerned with model summary statistics (given
the assumptions are met), and the second part is concerned with
evaluating the predictor variables (e.g. their coefficients).
Assumptions: Please notice the
mention of assumptions above. Regression also likely has the
distinction of being the most frequently abused statistical analysis,
meaning it is often used incorrectly. There are many assumptions of
multiple regression analysis. It is strongly urged that one consult a
good textbook to review all the assumptions of regression, such as
Pedhazur (1997). However, some of the more frequently violated
assumptions will be reviewed here briefly. First, multiple regression
works best under the condition of proper model specification;
essentially, you should have all the important variables in the model
and no un-important variables in the model. Literature reviews on the
theory and variables of interest pay big dividends when conducting
regression. Second, regression works best when there is a lack of
multicollinearity. Multicollinearity is a big fancy word for: your
predictor variables are too strongly related, which degrades
regression's ability to discern which variables are important to the
model. Third, regression is designed to work best with linear
relationships. There are types of regression specifically designed to
deal with non-linear relationships (e.g. exponential, cubic, quadratic,
etc.); but standard multiple regression using ordinary least squares
works best with linear relationships. Fourth, regression is designed to
work with continuous or nearly continuous data. This one causes a great
deal of confusion, because 'nearly continuous' is a subjective
judgment. A 9-point Likert response scale item is NOT a continuous, or
even nearly continuous, variable. Again, there are special types of
regression to deal with different types of data, for example, ordinal
regression for dealing with an ordinal outcome variable, logistic
regression for dealing with a binary dichotomous outcome, multinomial
logistic regression for dealing with a polytomous outcome variable,
etc. Furthermore, if you have one or more categorical predictor
variables, you cannot simply enter them into the model. Categorical
predictors need to be coded using special strategies in order to be
included into a regression model and produce meaningful interpretive
output. The use of dummy coding, effects coding, orthogonal coding, or
criterion coding is appropriate for entering a categorical predictor
variable into a standard regression model. Again, a good textbook will
review each of these strategies--as each one lends itself to particular
purposes. Fifth, regression works best when outliers are not present.
Outliers can be very influential to correlation and therefore,
regression. Thorough initial data analysis should be used to review the
data, identify outliers (both univariate and multivariate), and take
appropriate action. A single, severe outlier can wreak havoc in a
multiple regression analysis; as an esteemed colleague is fond of
saying...know thy data!
Covariates in Regression.
Introducing a covariate to a multiple regression model is very similar
to conducting sequential multiple regression (sometimes called
hierarchical multiple regression). In each of these situations, blocks
are used to enter specific variables (be they predictors or covariates)
into the model in chunks. The use of blocks allows us to isolate the
effects of these specific variables in terms of both the predictive
model and the relative contribution of variables in each block.
Multiple variables (be they covariates or predictors) can be entered in
each block. The order of entry of each block is left to the discretion
of the research; some prefer to enter the covariate(s) block first,
then the predictor(s) block; while others enter the predictor(s) block
then the covariate(s) block. The results would be the same in terms of R? change.
However, the use of blocks in
sequential/hierarchical regression and the use of blocks in evaluating
a covariate or covariates is NOT the same as
stepwise regression. Stepwise regression will not be discussed in this
tutorial.
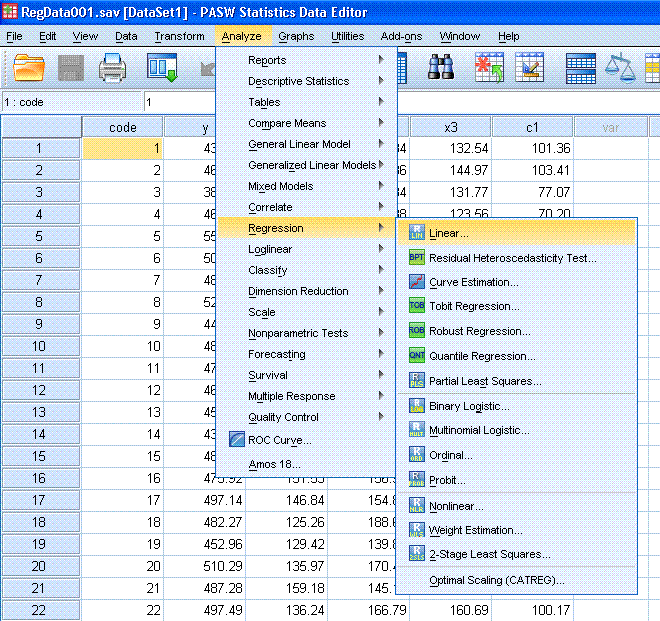
To conduct a standard multiple regression with the
evaluation of a covariate, start by clicking on Analyze, Regression,
Linear...
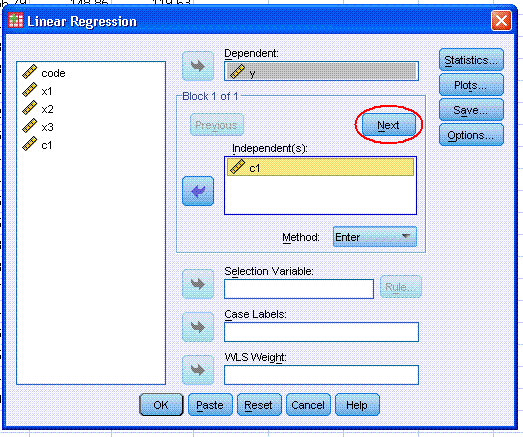
First,
highlight the y variable and use the top arrow button to move it to the
Dependent: box. Next, highlight the covariate (c1) and use the second
arrow button to move it to the Independent(s): box. Then, click the Next button (marked with a red
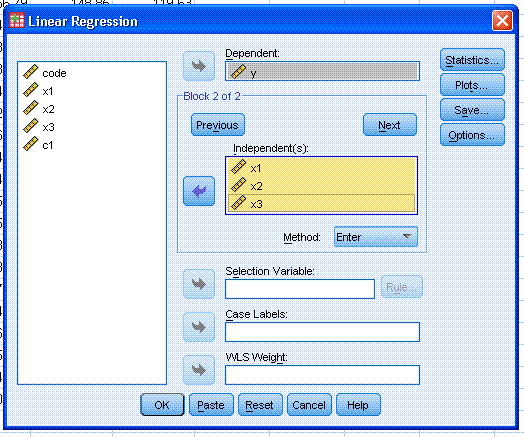
ellipse here). That was our first block. Next, highlight all three
predictor variables (x1, x2, x3) and use the second arrow button to
move them to the Independent(s): box. Notice, we now have two blocks
specified. Now click on the Statistics... button.
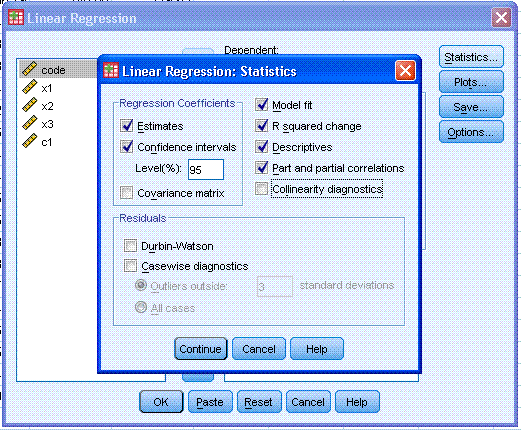
Next, select Estimates (default), Confidence
intervals, Model fit (default), R square change,
Descriptives, and Part and partial correlations. Then, click
the Continue button.
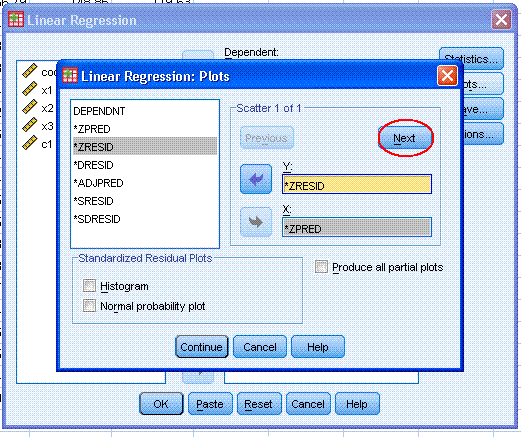
Next, click on the Plots... button. Then,
highlight *ZRESID and use the top arrow button to move it to the Y:
box. Then, highlight *ZPRED and use the bottom arrow button to move it
to the X: box. Then click the Next
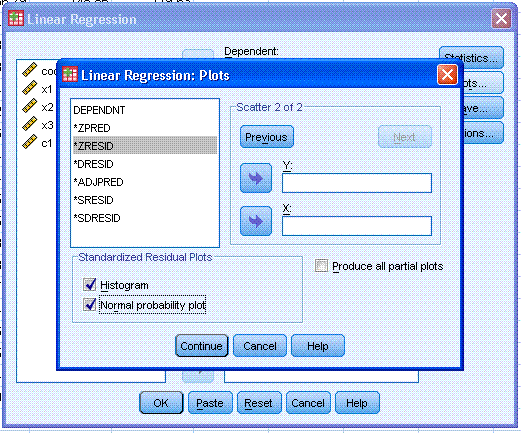
button (marked here with a red ellipse). Then select Histogram and
Normal probability plot. Then click the Continue button.
We could then click on the Save button and select
one of the distance metrics to allow us to evaluate outliers as was
done in the previous tutorial. However, we will skip that step here to
save space. Next, click the OK button to conduct the regression
analysis. The output should be similar to that displayed below.
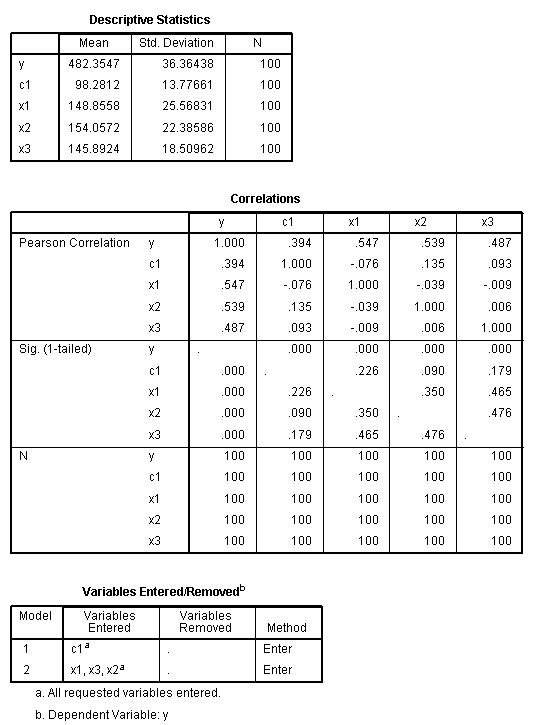
The first two tables are self-explanatory
provide straight-forward descriptive statistics for each variable in
our models. The second table, Variables Entered/Removed, displays which
variables were in which model; here the use of the word model is
synonymous with the word block. In the first block/model, the only
independent variable entered was c1 (the covariate). In the second
block/model, x1, x2, and x3 were entered (and c1 was not removed).
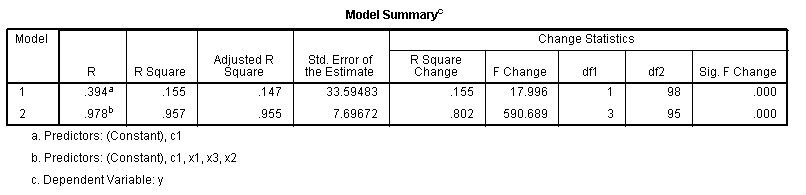
The next table, Model Summary, provides the usual
multiple correlation coefficient (R), R?, adj.R?,
and standard error for each model. The table also displays a few new
statistics which were not used in previous tutorials. The R? change shows how
much R? changed (first from
zero to model 1, then from model 1 to model 2). Then, F
statistics with degrees of freedom and associated p-values are given
for each change in R? to determine if the
change was significantly different from zero. The table shows that for
this example, the majority of influence is held by the predictors, not
the covariate--although the covariate by itself does contribute what
may be a meaningful amount (prior literature should inform
interpretation). It is important to realize that because we entered the
covariate first in its own model and did not remove it, the second
model and subsequent R? are cumulative. In
other words, it would be incorrect to suggest that model 2 includes
just the 3 predictors and accounts for 95.5 % of the variance in the
outcome variable (using adj.R?). It would be
appropriate to suggest that model 2, which includes all 3 predictors
and the covariate, accounts for 95.5 %
of the variance in the outcome variable (using adj.R?). It would also be
appropriate to suggest there was a significant increase in R?
from block 1 to block 2 such that the combination of the three
predictors and the covariate seem to account for a meaningful share of
the variance in the outcome variable.
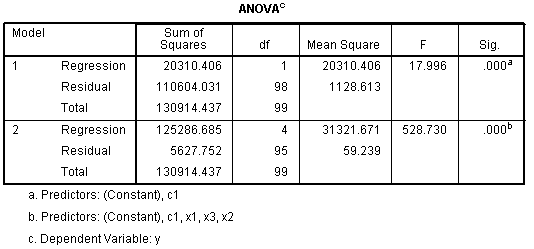
The
ANOVA table displays the test of each model's R? to determine if it
is significantly different from zero. Essentially, if a model is
significant, then we are accounting for significantly more than 0% of
the variance in the outcome with that model's independent variables (be
they predictors or covariates).
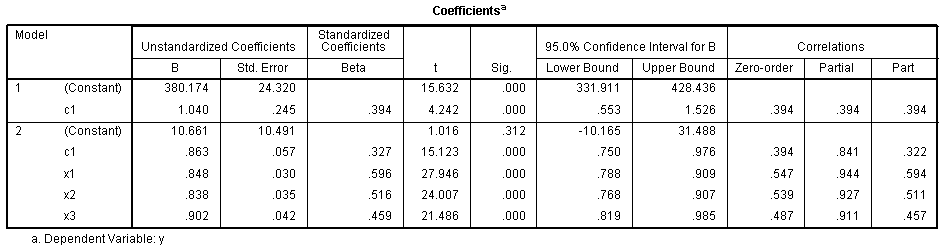
Next,
we have the Coefficients table which shows the unstandardized and
standardized coefficients necessary for constructing a predictive
regression equation in unstandardized or standardized form. We can also
use the information in this table to get some idea of variable
importance. So, for instance, in the first model where the covariate
(c1) is the only independent; we know the Beta (β) coefficient is
simply the correlation between the covariate and the outcome (because
model 1 is simply a bivariate regression). Furthermore, if we square
that standardized coefficient, then we get the squared multiple
correlation from the model summary table above (.394? =
R? = .155) which means the covariate
explains 15.5% of the variance in the outcome. So, we know each Beta is
simply a correlation coefficient between a predictor (or covariate) and
the outcome. However, Beta coefficients in model 2 are interpreted
slightly differently. For instance, we could say that the x1 variable
accounts for 35.5% of the variance in the outcome variable after
controlling for the covariate (c1). The x1 Beta (β = .596) can be
squared to give us the percentage (.596? = .355). These standardized
coefficients (Beta or β) represent slopes, or rise over run, in a
standardized linear regression equation. So, the larger the Beta, the
more influential the variable it is associated with, if
multicollinearity is not present. The greater the multicollinearity,
less reliable the Beta coefficients will be at indicating variable
importance. Essentially, if your predictors and/or covariates are
strongly related, then you can not rely on the Beta coefficients as
indicators of variable importance.
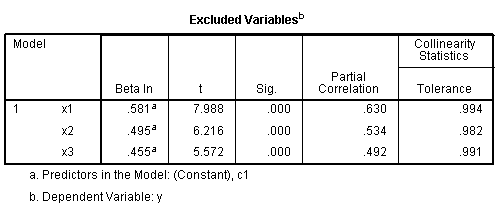
Next, we have the Excluded Variables table which
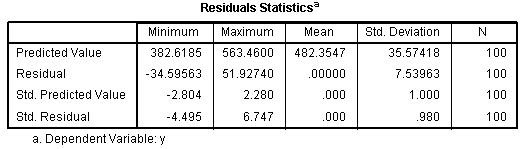
shows which variables were excluded from each model. Next, we have the
Residuals Statistics table which reports descriptive statistics for the
predicted and residual values.
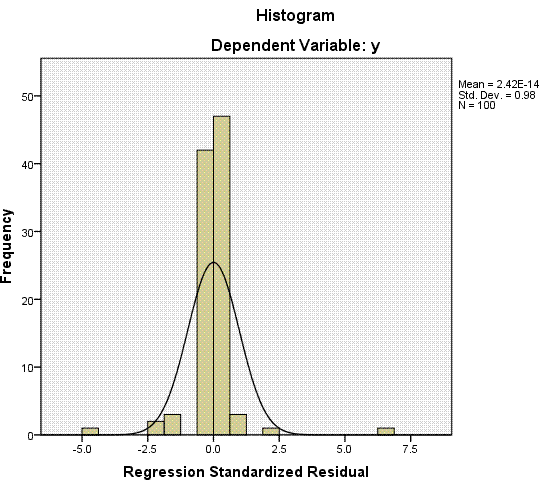
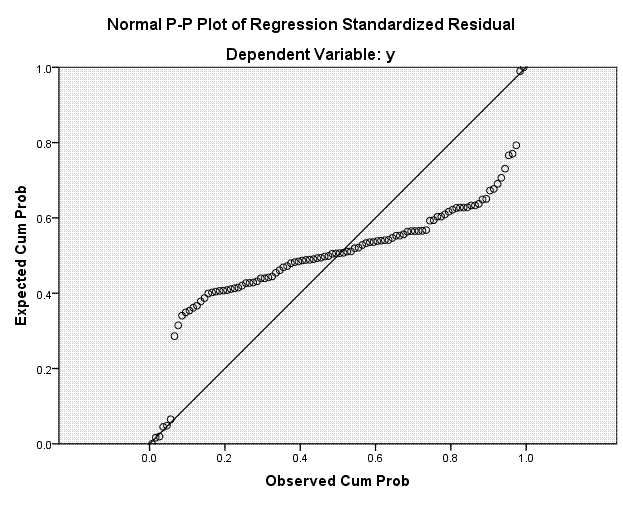
Finally,
we have our histogram of standardized residuals, which we expect to be
centered on zero; and our Normal P-P Plot where we hope to see the
expected standardized residuals and the observed standardized residuals
closely following the reference line.
Keep
in mind the distinction between a covariate and a predictor is often
simply a matter of semantics. It may be the case that socio-demographic
variables (i.e. age, income, etc.) are influential predictors in one
study, where in another they are considered covariates or confounds in
comparison to predictors of interest (i.e. standardized measures of
intelligence, depression inventories, body mass index, etc.). In either
case, the phrase sequential or hierarchical regression may be used to
describe the procedure of using blocks to distinguish between one group
of predictors (i.e. socio-demographic variables) and another group of
predictors (i.e. measures of intelligence).
REFERENCES &
RESOURCES
Achen, C. H. (1982). Interpreting and
using regression. Series: Quantitative Applications in the
Social Sciences, No. 29. Thousand Oaks, CA: Sage Publications. (1)
Akaike, H. (1974). A new look at the statistical
model identification.
I.E.E.E. Transactions on automatic control, AC 19, 716 –
723. (1)
(2)
(3)
Allison, P. D. (1999). Multiple regression.
Thousand Oaks, CA: Pine Forge Press.
Cohen, J. (1968). Multiple regression as a general
data-analytic system.
Psychological Bulletin, 70(6), 426 - 443. (1)
Hardy, M. A. (1993). Regression with
dummy variables. Series: Quantitative Applications in the
Social Sciences, No. 93. Thousand Oaks, CA: Sage Publications. (1)
Harrell, F. E., Lee, K. L., & Mark, D. B.
(1996). Multivariate prognostic models: Issues in developing models,
evaluating assumptions and adequacy, and measuring and reducing errors.
Statistics in Medicine, 15, 361 – 387.
(1)
(2)
(3)
Kass, R. E., & Raftery, A., E. (1995).
Bayes factors. Journal of the American Statistical
Association, 90, 773 – 795. (1)
(2)
(3)
Pedhazur, E. J. (1997). Multiple
regression in behavioral research: Explanation and prediction
(3rd ed.). New York: Harcourt Brace.
Schwarz, G. (1978). Estimating the dimension of a
model. Annals of Statistics, 6, 461 – 464. (1)
(2)
(3)
Tabachnick, B. G., & Fidell, L.
S. (2001). Using Multivariate Statistics.
Fourth Edition. Boston: Allyn and Bacon.
|