|
t-tests
in SPSS.
The t-tests are used to
determine if there exists a significant difference between means. There
are traditionally, three types of t-tests. The
seldom used one sample t-test, the dependent
samples t-test, and the independent samples t-test.
For the duration of this tutorial, we will be using
ExampleData001.sav
(1). One sample t-test
is used to determine if the sample mean is
different from some constant value; typically assumed to be a
population mean.
First, we'll test whether or not our sample mean
(in this case age) is significantly different from zero. Begin by
importing the data, then click on Analyze, Compare Means, One-Sample T
test...
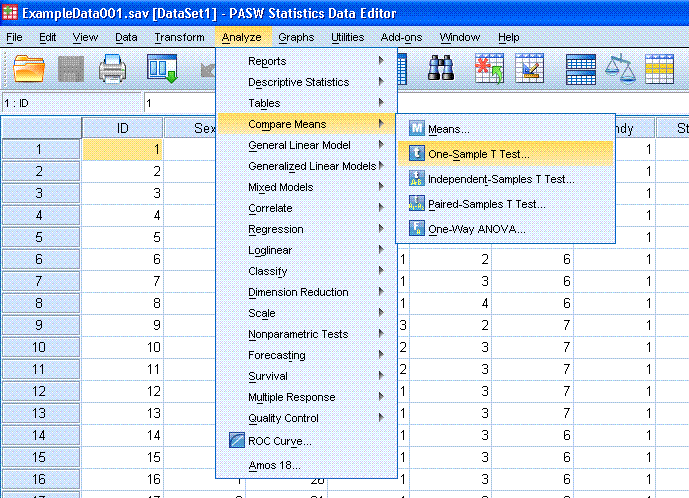
Next, highlight the Age variable and use the arrow
to move it into the Test Variable(s): box.
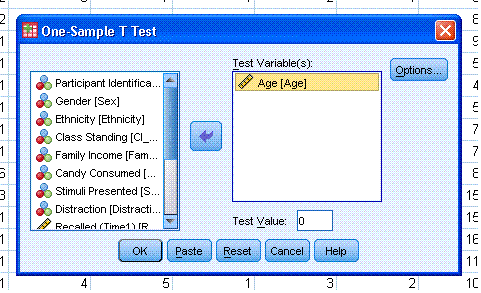
Next, click the OK button to complete the t-test.
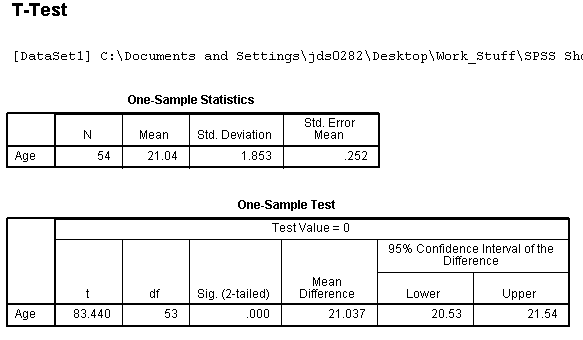
The output provides two tables. The first, offers
descriptive statistics for the variable we tested (Age), which includes
number of cases/observations, mean, standard deviation, and standard
error. The second table provides the actual t-test output--where we see
that our sample's age (M = 21.04, SD =
1.85) was significantly different from zero, t(53)
= 83.440, p < .001. As you might imagine,
this is not terribly useful information. A more informative test might
include testing whether or not our sample is significantly different
from a specified value. SPSS allows us to specify a value in the One
Sample T Test dialog.
Again, click on Analyze, Compare Means, One-Sample
T test...

Notice the previous run is still specified (i.e.
the Age variable is already in the Test Variable(s): box.
Next, we want to specify a value, say 20 which
might represent the mean of all undergraduate college students. We
simply type the value in the
Test Value: box.
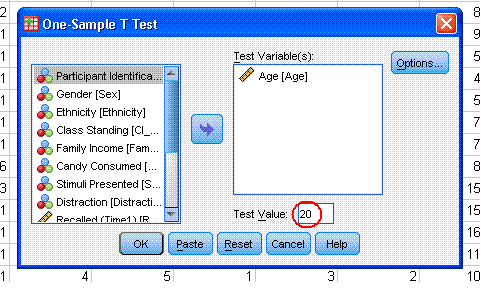
Then click the OK button to complete the t
test.
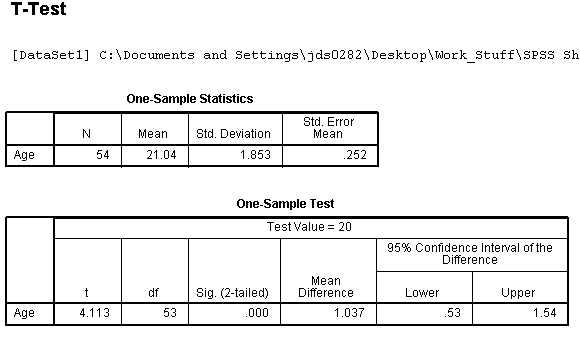
Here, we see that our sample's age (M =
21.04, SD = 1.85) was significantly different from
20, t(53) = 4.113, p <
.001.
(2). Dependent samples t-test
is used to determine if the difference between
two related sample means is different from zero.
It is known by many names: dependent samples t test,
paired samples t
test, repeated measures t test, etc. SPSS refers
to it as the Paired-Samples T test.
First, click on Analyze, Compare Means,
Paired-Samples T test...
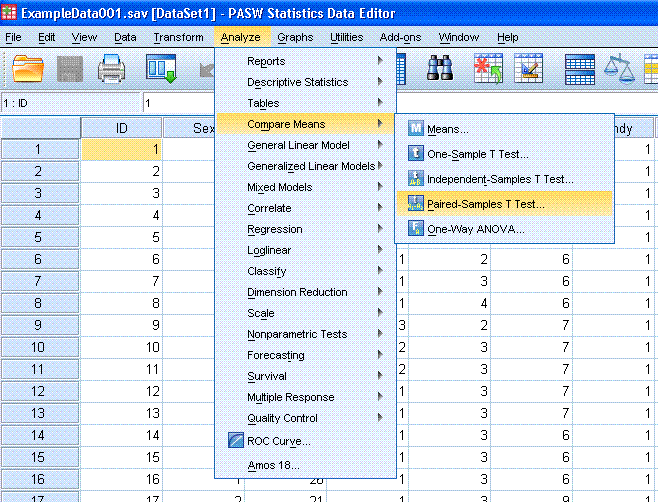
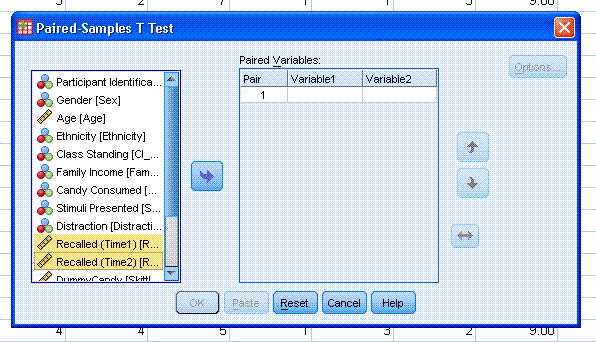
Next, select Recalled (Time1) and using the
control key and left mouse click to select Recalled (Time2); which
identified the pair of variables you are testing.
Next, use the arrow button to move the variable
into the Paired Variables: box.
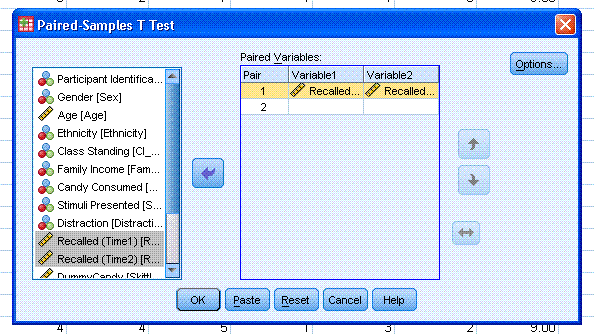
Next, click the OK button to complete the t
test.
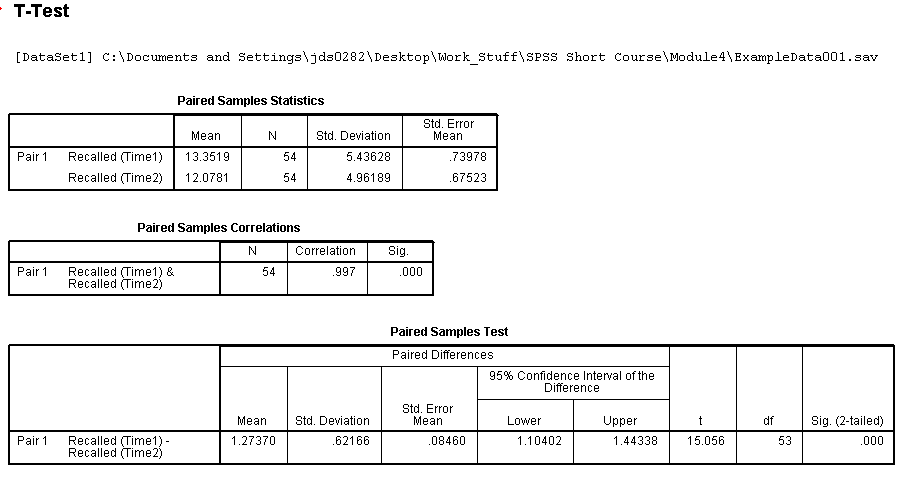
The three tables produce are fairly
self-explanatory. The first provides descriptive statistics for each
variable. The second provides the correlation between the two variables
to verify that the variables are in fact related, making the dependent t
test appropriate. The third table provides the
output for the t test. Here, we can see the
difference between Recall at time 1 (M = 13.35, SD
= 5.44) and Recall at time 2 (M =
12.08, SD = 4.96) was significantly
different from zero t(53) = 15.06, p <
.001.
(3). Independent samples t-test
is used to test whether or not two independent
sample means are significantly different from one another. It is the
most commonly used of the t tests.
Again, begin by clicking on Analyze, Compare
Means, Independent-Samples T test...
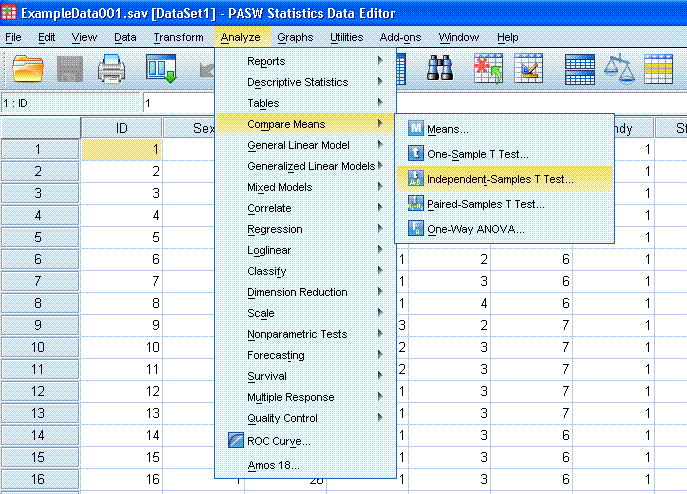
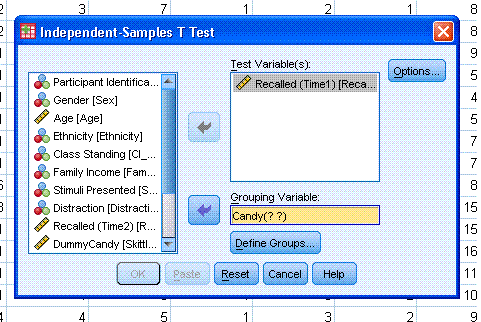
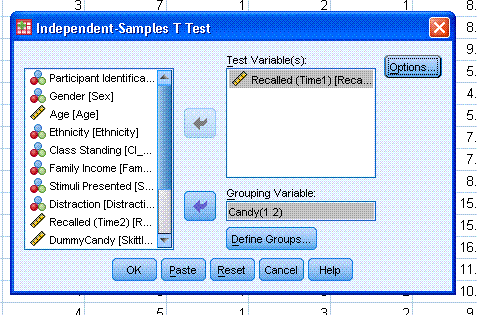
Next, select Recalled (Time1) and use the top
arrow button to move it to the Test Variable(s): box. This represents
the dependent variable and should be continuous or nearly continuous.
Next, select the Candy Variable and use the bottom arrow button to move
it to the Grouping Variable: box. This represents our independent or
grouping variable.
Next, click on the Define Groups... button. Type a
1 into the Group 1: box and type a 2 into the Group 2: box. Next, click
the Continue button.
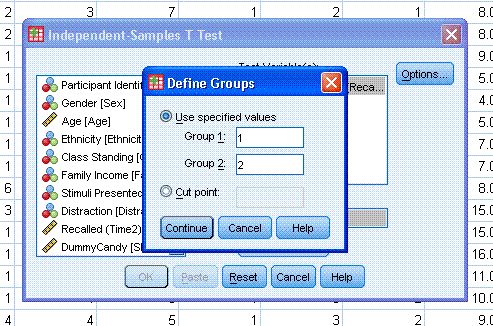
You should see the following.
Next, click on the OK button to complete the t
test. You should now see the output resembling
the following tables.
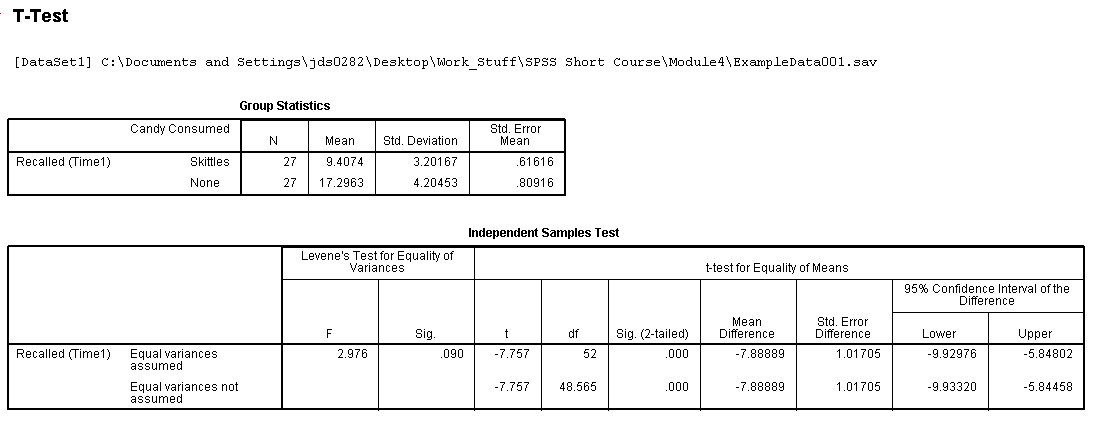
As is usually the case, the first table provides
descriptive statistics. The second table provides the results of the t
test. Interesting to note is the Levene's Test
for Equality of Variances. This tests the assumption that our two
groups have approximately equal variances; sometimes called the
homogeneity of variance assumption (see
this
article for a discussion). In the current example, the
Levene's test indicates we do not have significantly different
variances between our two groups, which is what we want to see as this
supports the assumption. The t test results
indicate that the participants of the Skittles group (M =
9.41, SD = 3.20) recalled significantly fewer
words than did the participants of the no candy group (M =
17.30, SD = 4.20), t(52) =
-7.76, p < .001.
(4) Effect Size
It is no longer acceptable to simply report the
statistics and their associated p values for
inferential procedures. An effect size should also be reported with
every inferential analysis. The appropriate effect size metric for a t
test is d (Cohen,
1992), which involves a relatively simple calculation and
provides a standardized estimate of the difference between two groups.
Unfortunately, SPSS does not provide any way of obtaining Cohen's
d. The formulas are available in both the article provided
and at
Wikipedia
for calculating Cohen's d for each type of t
test reviewed here.
Reference
Cohen, J. (1992). A power primer. Psychological
Bulletin, 112, 115 - 159. doi: 10.1037/0033-2909.112.1.155
(5). Graphing
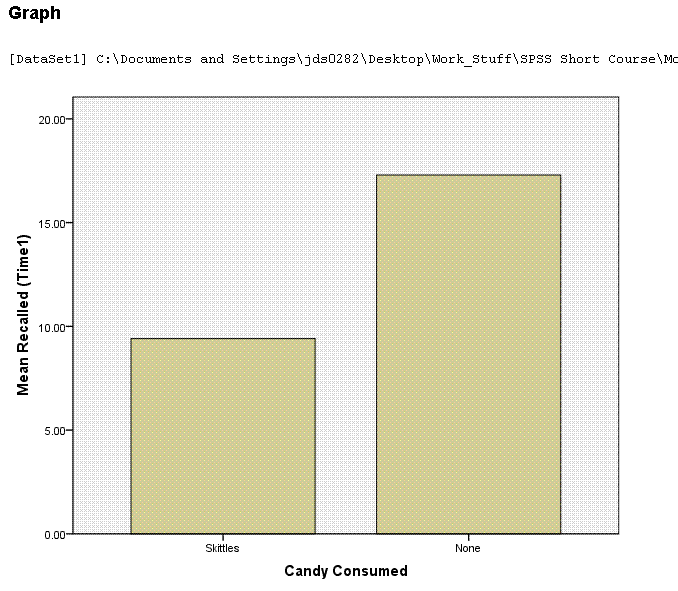
We'll use a bar chart because we are dealing with
a categorical variable whose effect is shown on a continuous variable.
One could also use other types of graphical representations. To graph
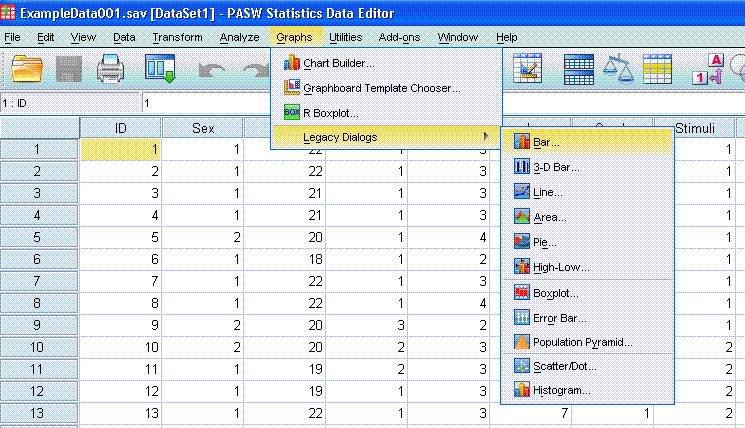
the Independent Samples T test effect we have discovered, simple click
on Graphs, Legacy Dialogs, Bar...
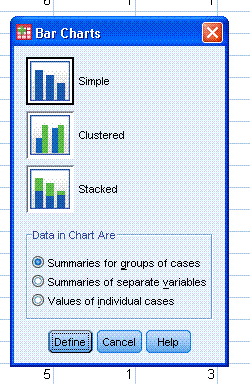
Next, click on the Define button (the defaults
Simple & Summaries for groups of cases are appropriate for this
example). Next, click
on the circle next to Other statistic (e.g., mean).
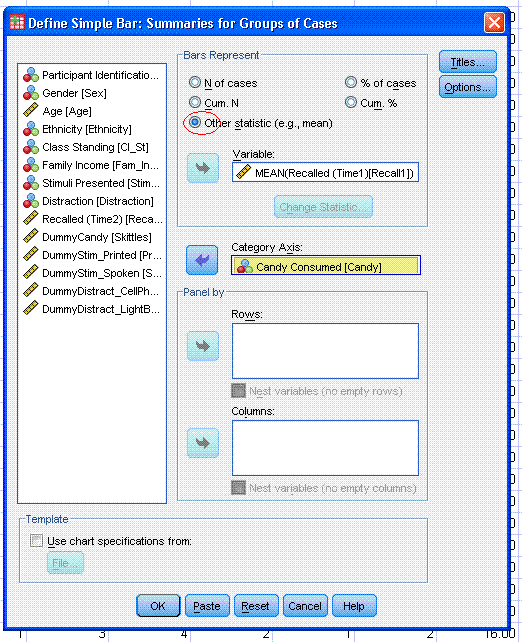
Next, highlight the variable Recalled (Time1)
[Recall1] and use the top arrow button to move it to the Variable: box
in the Bars Represent area. Then, highligh the variable Candy Consumed
[Candy] and use the second arrow from the top to move it to the
Category Axis: box. Next, click the OK button.
|


