
Introduction to EViews
Quantitative Micro
Software (QMS) Homepage
Creation date: 03/21/05
Author: Patrick McLeod
Objectives: This course is designed to familiarize the user with the EViews statistical software. It is designed for beginning users who want to get started with the program and experienced users who want to acquaint themselves with the latest version of the EViews, version 5. After this course, you should be able to answer the following questions:
1. What is EViews? How do I navigate and use EViews?
2. How do work with data? What's a series? What's a group?
3. How do I graph data in EViews? Can I create tables in EViews?
4. What kind of statistical methods can I implement in EViews?
5. Show me an example that incorporates all the steps!
I. What is EViews?
from http://www.eviews.com/eviews5/eviews5/ev5over.html :
The goal in designing EViews was to make it both powerful and intuitive. A wide range of statistical and graphical techniques had to be made available without requiring users to memorize complicated command syntax or navigate layers and layers of menus. The solution is an innovative object-oriented user interface.
EViews is built around the concept of objects. Series, equations, and systems are just a few examples of objects. Each object has its own window, its own menus, its own procedures, and its own views of its data. Most statistical procedures are simply alternative views of the object. For example, a simple menu choice from a series window changes the display between a spreadsheet, line and bar graphs, a histogram-and-statistics view, a correlogram, and a unit root test.
Similarly, an equation window allows you to switch between a display of the equation specification, basic estimation results, the coefficient covariance matrix, graphics depicting the actual, fitted, and residual values for the dependent variable, tables, forecast graphs and evaluations, and more than a dozen diagnostic and hypothesis tests.
Naturally, you can cut-and-paste any of these views into your favorite word processor with a simple menu selection. And it's just as easy to exchange data and results with your spreadsheet and database programs.
EViews directly reads and writes an extensive list of data formats, including Excel, ASCII/Text, SAS, Stata, SPSS, RATS, Html, Access, Binary, ODBC Databases, ODBC queries (ODBC requires the Enterprise version), and many others. To open most data files you can simply drag-and-drop them onto EViews.
Unlike some other econometric software, there is no reason for most users to learn a complicated command language. EViews' built-in procedures are a mouse-click away and provide the tools most frequently used in practical econometric and forecasting work.
Basic Statistics
Basic descriptive statistics are easily computed over an entire sample, by a categorization based on one or more variables, or by cross-section or period in panel or pooled data. Hypothesis tests on mean, median and variance may be carried out, including testing against specific values, testing for equality between series, or testing for equality within a single series when classified by other variables (which allows you to perform one-way ANOVA).
You can graphically view the distribution of your data using histograms, or cumulative distribution, survivor, and quantile plots. QQ-plots (quantile-quantile plots) can be used to compare the distribution of a pair of series, or the distribution of a single series against a variety of theoretical distributions. You can even perform Kolmogorov-Smirnov, Liliefors, Cramer von Mises, and Anderson-Darling tests to see whether your series is distributed normally, or whether it comes from another distribution such as an exponential, extreme value, logistic, chi-square, Weibull, or gamma distribution. You may provide parameters for the distribution, or let EViews estimate the parameters for you. EViews also calculates kernel density estimates, and produces scatter plots with curve fitting using ordinary, transformation, kernel, and nearest neighbor regression.
To explore the time series properties of your data, EViews provides unit root tests (ADF, Phillips-Perron, KPSS, DFGLS, ERS and Ng-Perron for single time series and Levin-Lin-Chu, Breitung, Im-Pesaran-Shin, Fisher, and Hadri for panel data), cointegration tests (with MacKinnon-Haug-Michelis critical values and p-values), causality tests, autocorrelation and partial autocorrelation functions, Q-statistics, and cross-correlation functions.
EViews provides random number generators (Knuth, L'Ecuyer or Mersenne-Twister), density functions and cumulative distribution functions for eighteen different distributions. These may be used in generating new series, or in calculating scalar and matrix expressions.
Seasonal AdjustmentEViews 5 provides easy-to-use front-end support for the U.S. Census Bureau's X11 and X12-ARIMA seasonal adjustment programs, as well as the Tramo/Seats software frequently used in Europe. Simple seasonal adjustment using additive and multiplicative difference methods is also supported in EViews.
FiltersEViews computes trends from time series data using the Hodrick-Prescott filter. New to EViews 5 is the ability to apply Baxter-King, Christiano-Fitzgerald fixed length and Christiano-Fitzgerald asymmetric full sample band-pass (frequency) filters to your data.
Estimation
EViews includes a wide range of single and multiple equation estimation techniques for both time series and cross section data. Basic estimators include ordinary least squares (multiple regression), two-stage least squares, and nonlinear least squares. Weighted estimation is available with all of these techniques. Specifications may include polynomial lag structures on any number of independent variables.
In addition to these basic estimators, EViews supports estimation and diagnostics for a variety of advanced models.
EViews' sophisticated calculus engine computes and displays analytic derivatives for the majority of nonlinear regression specifications.
ARCH modelsIf the variance of your series fluctuates over time, EViews can estimate the path of the variance using a wide variety of Autoregressive Conditional Heteroskedasticity (ARCH) models. EViews handles GARCH(p,q), EGARCH(p,q), TARCH(p,q), PARCH(p,q), and Component GARCH specifications and provides maximum likelihood estimation for errors following a normal, Student's t or Generalized Error Distribution. The mean equation of ARCH models may include ARCH and ARMA terms, and both the mean and variance equations allow for exogenous variables.
Generalized Method of Moments
EViews supports GMM estimation for both cross-section and time series data (single and multiple equation). Weighting options include the White covariance matrix for cross-section data and a variety of HAC covariance matrices for time series data. The HAC options include prewhitening, either quadratic or Bartlett kernels, and fixed, Andrews, or Newey-West bandwith selection methods.
Limited Dependent Variables
When your dependent variable takes on a limited set of values or is censored or truncated, EViews can take account of this information in the estimation procedure. Binary, ordered, censored, and truncated models may be estimated for likelihood functions based on normal, logistic, and extreme value errors. Count models may use Poisson, negative binomial, and quasi-maximum likelihood (QML) specifications. EViews optionally reports generalized linear model or QML standard errors.
System Estimation
EViews supports estimation of both linear and nonlinear systems of equations by OLS, two-stage least squares, seemingly unrelated regression, three-stage least squares, GMM, and FIML. The system may contain cross equation restrictions and autoregressive errors of any order.
Vector Autoregression/Error Correction Models
Vector Autoregression and Vector Error Correction models can be easily estimated by EViews. Once estimated, you may examine the impulse response functions and variance decompositions for the VAR or VEC. VAR impulse response functions and decompositions feature standard errors calculated either analytically or by Monte Carlo methods (analytic not available for decompositions) and may be displayed in a variety of graphical and tabular formats.
...and much more. For more information on other estimation techniques and forecasting options in EViews, please visit http://www.eviews.com/eviews5/eviews5/ev5over.html .
EViews is a Windows-only software package. At UNT, Academic Computing Services maintains a network installation of EViews that is accessible to UNT faculty, staff and students via the General Access Labs. Not all General Access Labs have the same configuration of software, though all do have access to the ACS Gauss server where EViews resides. As of this writing, the only General Access Labs that I am aware of that offer EViews as a menu item are the College of Arts and Sciences GALs (GAB, Terrill and Wooten).
EViews can be purchased at a discounted rate for individual use through the Academic Computing Services Research and Statistical Support office. You must be a faculty member, staff member or student at UNT or one of the UNT System schools to qualify for this discounted price. You will need a signed form from Patrick McLeod to either fax or mail to QMS to qualify for this discount. Please email me at mcleod@cc.admin.unt.edu or call me at 940-565-4066 with any questions.
II. At First Blush:
Navigating EViews
EViews is an object-oriented software package. This is a departure from the usual configuration of statistical software packages such as SPSS, SAS and Stata, though S-Plus and R both utilize a similar object configuration.
The EViews environment contains two basic areas: The empty white area in the image above is what EViews refers to as the Command Window. You can type commands directly into this window and execute them by pressing the Enter key. The large gray area in the image above is what EViews refers to as the Work Area. This is where your workfiles, data windows, graphs and estimation results will be displayed.
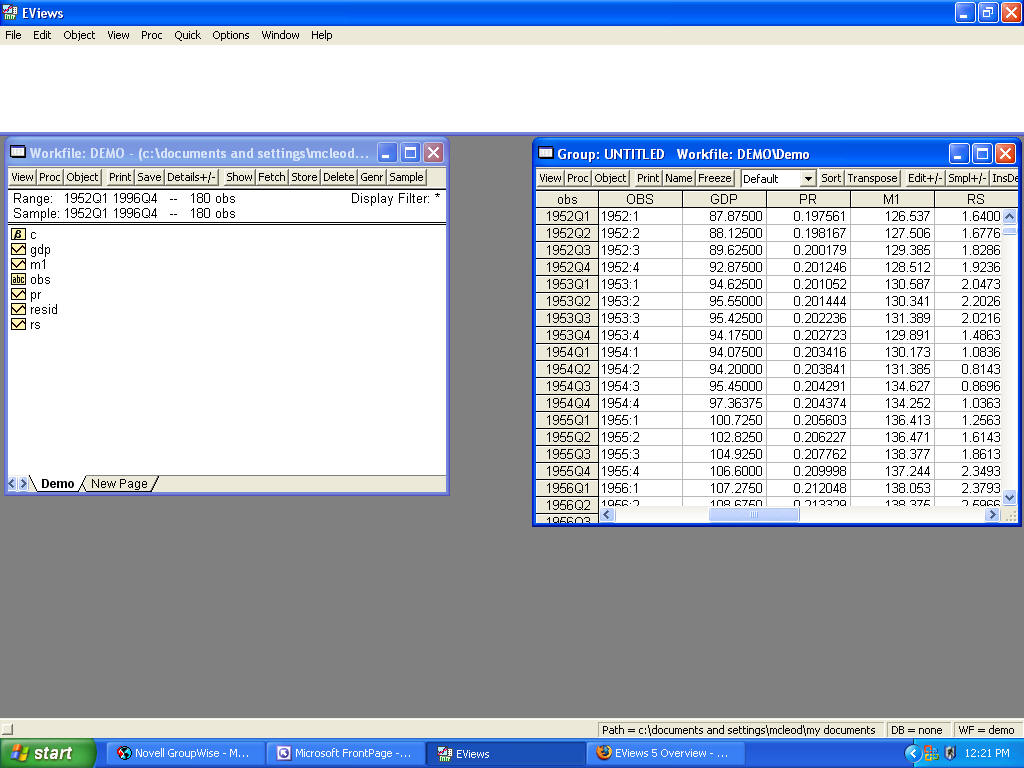
Workfiles
The basic object of structure within EViews is the workfile. A workfile is simply a data set that is either imported from some foreign format into EViews or that is already in EViews format. Each workfile window has a separate set of menu items and buttons for manipulating and storing information from that workfile.
Groups
Groups are the nuts and bolts of analysis and estimation in EViews. A group consists of a list of Series identifiers.
Downloads
Download Demo.xls
Download International Finance EViews workfile
Last updated: 01/18/06 by Patrick McLeod