
Introduction to SAS 8
Data | Procedures | Examples | Download | Exercise | Evaluation
Creation date: 10/13/98
Author: Karl Ho

Objectives: This SAS class is designed for beginning users who want to get started with the program and experienced users who want to get to know the new generation of the SAS system. After this course, you should be able to:
I. What is SAS?
II. Availability of SAS for Windows?
III. Using SAS for Windows
IV. SAS data handling - Data Step
V. SAS Files
VI. SAS Procedures
Appendix: SAS function keys
SAS stands for Statistical Analysis System. It is both a statistical language and a system that performs sophisticated data management and statistical analysis. SAS is available in multiple computing environments. At the University of North Texas, we have obtained the licenses of the software for different operating systems including Windows, Mac, OS/MVS, VM/CMS, and UNIX. In this series, we focus on SAS 8 for Windows, which is a complete data analysis program with capabilities comparable to, and, in some aspects, surpassing, its mainframe counterpart. SAS for Windows will do every task that other editions of SAS do, plus it is easy to use and its graphic user interface can do a lot more in graphical analyses than the mainframe or UNIX versions. The only limitation to SAS for Windows is the hardware that it is run on. Although, SAS runs on all classes of IBM personal computers and true IBM compatible machines, faster micro processors are preferable. A Pentium class machine is recommended. The latest version of the software, SAS 8, can run on Windows 95, Windows 98 and Windows NT.
II. Availability of SAS for Windows?
SAS software is distributed through the university's site license agreement with SAS Institute. UNT has a site license that allows students to use the software in any general access labs on campus. Full-time faculty and staff can request SAS installation on their machines on campus or at home. For students who want to install the software at their home machines, a student edition of the software is available for sale at the UNT bookstore. Check the UNT bookstore or the RSS office for more details pertaining to the student version of SAS.
UNT students and faculty are also eligible to use SAS on other platforms than Windows. It is available on UNIX, CMS and MVS. Users who want to use the mainframe/central host version of the software need to have a UNIX/sol account or a CMS account. Application for these accounts are available to the Computing Center Helpdesk (565-2324).
1. New Windows Display System
The new SAS 8 expands from the previous version to include three new elements on top of its basic three window display system. The Explorer window and Results window provide user better control and organization of the SAS objects (e.g. SAS libraries, SAS data sets) and system output. The latest Enhanced Editor provides a more sophisticated programming editor that is equipped with color coding, macro features and better customizability for programmers' needs. For more new features of the new Enhanced Editor, see Appendix I. Despite that there are more windows to deal with, the new SAS 8 workspace is more versatile and easier to use with the new windowing design.
In its original design, the SAS Display Manager System is composed of three smaller windows labelled: Program Editor, Log, and Output. The first of which is for program input while the latter two respectively provide the program system log information and the output of the program. The program log is primarily diagnostics of the programming syntax and gives information about if the program was written correctly and hints for debugging otherwise. It also reports information about site license, user information, and the SAS release number. The Output window is where results output by SAS procedures are shown. If the program does not go through correctly, the output window will usually be blank or report the previous output.
The new Explorer window provides easy access to SAS objects such as File shortcuts and Libraries objects. You can assign SAS programs or different versions of the same program to a clickable shortcut object using the File shortcut. Accessing SAS libraries and data sets are much easier in version 8. All objects are clickable with activation of appropriate windows such as the Viewtable window for data sets.
The Result window is another Windows Explorer-like utility that allows output to be organized in a hierarchical fashion.
2. Keys Windows - A Road Map to SAS windows
The new SAS 8 has even more windows than its predecessor. To name a few, apart from the three default windows, they include the Library window, Filename window, Viewtable window, Keys window, Options window, Graphic windows, etc. It is imperative to use a "Road Map" to surf around the SAS workspace. The Keys window plays such a role that guides and gives you shortcuts to different windows. To activate the Keys window, point and click on the Command box at the upper left corner and type "keys" (case-insensitive).
The Keys window allows you to assign function keys to switch to the most frequently used windows and perform the most used functions. In the above example, the F5, F6 and F7 are assigned to default windows (Program Editor, Log and Output respectively) as in the previous versions and versions in other operating environments. For the rest of the function keys and hot keys (a combination of function keys, letter keys Control and/or Shift keys), you are basically free to assign what you want or what you use most. For instance, assigning F12 to "next" allows you to switch to the next window, F2 to "lib" to open the library window, etc. It is much more convenient to use the function keys than clicking on the menu to perform the frequently used functions or windows. An alternative is to take advantage of the window tabs at the bottom of the SAS window. Taking after the Window 95 taskbar, this SAS taskbar provides shortcut to the open windows.
3. Entering SAS Statements
To enter SAS statements, simply move the cursor to the Program Editor window and click the left mouse button. You can also hit the function key F5 or click on the Program Editor tab at the bottom to perform the same task.
A SAS program normally starts with a data step. Each statement can go on several lines, but it MUST end with a semi-colon. If you want to go to the next line, simply press ENTER.
Conventions on Windows operations are applicable in SAS for Windows. Cutting and pasting, for example, make program editing much easier for users.
By default, SAS for Windows displays the three windows simultaneously. But, you can select Cascade or Tile under Window option at the menu bar to choose the format of display.
Normally, only one window is active at a time. Simply moving the cursor to a particular window and click within the window area and the color change on the panel (top bar of the window) notifies which is the active window. When you enter a SAS session, the Program Editor window is active by default. To make the LOG window active, type LOG at the command box located at left hand corner underneath the menu bar.
4. Submitting SAS Statements
When you have entered your program correctly, you are ready to submit these statements for execution. There are many ways to do so. You can:
1. press F3 or;
2. type SUBMIT at the command box right below the menu bar or;
3. click your right mouse button and select LOCAL, SUBMIT.
Processing of a SAS Program
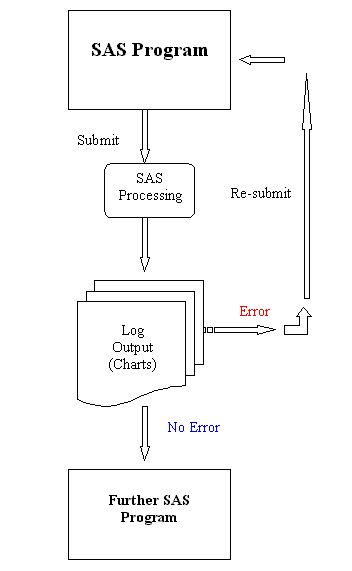
If something goes wrong in your SAS statements, SAS will issue error messages in the LOG window. To check if there is an error message, you need to go to the LOG window. Type LOG at the Program Editor command line. Use PageUp and Page Down keys to scroll up and down the window. When the error is located, you may want to go back to your SAS program and make some changes. Type PGM at the command line in the LOG window to make your Program Editor window active. At the command line in the Program Editor type RECALL, you will get your SAS program back. An easy way to do so is to hit F4.
5. Saving SAS Statements
If you wish to save your SAS program, click File on the menu and select save. Give a file name like "A:\mypgm.sas", which saves the SAS program file on to your floppy diskette. Alternatively, you can also type in the command box "FILE A:\mypgm.sas". This will save every thing on the Program Editor window into drive A: under the name MYPGM.SAS. The same applies to the LOG and OUTPUT windows. Note that by convention, the file extension .sas stands for SAS program files, .log stands for SAS log files and .lst stands for listing or output files.
|
*.sas - SAS program file *.log - SAS log file *.lst - SAS output file |
6. Bringing SAS Programs into a SAS Session
If you want to bring a file into the SAS Program Editor window once you have been in SAS for Windows session, type INCLUDE 'A:\MYPGM.SAS' at the Program Editor command line. An alternative way is to use the menu bar and choose from the FILE option. SAS will retrieve a file named 'MYPGM.SAS' from drive A: into the Program Editor window.
7. Ending a SAS Session
To end a SAS session, double click the uppermost left hand corner button or type ENDSAS at the command line in any window. You can close any window by typing END at the command line when the window is active.
IV. SAS data handling - Data Step
Normally, SAS users do not pay attention to what type of files SAS uses in a SAS session. This section distinguishes several types of files that SAS can handle. Knowing this, you will be able to use each type of file advantageously.
| A DATA step consists of a group of statements that reads ASCII text data (in a computer file) or existing SAS data sets in order to create a new SAS data set. |
A data file that has been entered in the SAS Data step after the CARDS command needs to
be converted into a SAS data file before SAS can use it. The DATA step takes care of this
conversion.
Example:
Data;

input x y z @@;

cards;

1 2 3 4 5 6 7 8 9

;

run;
This sample SAS program creates a temporary data set using the CARDS statement to read in the in-line data. The Data statement defines a temporary data set; the INPUT statement defines the variables and their formats; the CARDS statement gives instruction to start reading in the data that follow. The RUN statement ends this session of the program and submits for processing.
The DATA step must begin with the DATA statement and should end with a RUN statement.
Data set can be created and stored in a permanent library. Otherwise, it will stay in a temporary library (by default, WORK) which lasts as long as the current SAS session, i.e. such data sets will be erased when you exit SAS. Data manipulation must be done in a DATA step and cannot be done in a PROC step.
Data set options specify actions that apply only to the SAS data set with which they appear. They let you perform such operations as:
- creating new variables out of existing variables or random functions
- renaming variables
- selecting only the first or last n observations for processing
- dropping variables from processing or output
- specifying a password for a SAS mainframe data set.
| A SAS data library is a collection of SAS files that are recognized as a unit by the SAS system. |
The three most common forms of general syntax for the DATA step are:
1.

2.

3.

The following examples illustrate how to implement these three data methods.
In example 1, a temporary data set is defined and an external raw data file is read in using INFILE. The INPUT specifies the variable names, locations and formats of the variables.
Example 1
data geol;

    infile 'filename';

    input state $ 1-3 county $ 5-12 sqmile 14-19

        region 22-24 tract 27-29 code $ 32-33

        rainfall 37-40 temp 43-46 temptype $ 49;

proc print data=geol;

run;
Example 2 illustrates the use of pre-stored data sets with the SET command. Note that the data set is a permanent one stored under the library SASWS1.
Example 2
libname sasws1 'd:\temp';

data geolnew;

    set sasws1.geol

proc print data=sasws1.geol;

run;
The third example shows combining the current data sets geol
and district into one data set called combine. Is this data set permanent or temporary?
Example 3
data combine;

    merge geol district;

run;
Manipulating and subsetting data set
The following example applies the if/then statements to create variables based on certain conditions.
If-Then/Else Statements
Example 4
libname sasws1 'd:\temp';

DATA SASWS1.COUNTRY;

  INFILE 'd:\temp\country.dat';

  INPUT DEC 1 ID 2-4 NAME $CHAR26. SSCODE 31-33

        CONTIN $ 34-35 DODEV 36 POPULATE 37-43

        AREA 44-49 GNP 50-56 MILEXPED 57-64 .1

        PEDEXPED 65-71 .1;

DATA temp;

SET sasws1.country;

  IF GNP GE 20000 THEN GNPNEW = 'high';

  ELSE IF 10000 < GNP < 20000 THEN GNPNEW='med';

  ELSE GNPNEW='lo';

RUN;

PROC PRINT;

VAR GNP GNPNEW;

RUN;
This program also demonstrates the use of the IF-THEN/ELSE statements. The third statement creates a new variable named GNPNEW and assigns it the value "high" if the observation has a value greater than or equal to (GE) 20,000 for the variable named GNP. The next statement uses a compound inequality (i.e.,10000 < GNP < 20000 ) to assign the value med to GNPNEW if the observation's value for GNP is between 10000 and 20000. Finally, the fifth statement assigns the value lo to GNPNEW to all other observations -- that is, to all observations with a value for GNP that is missing or less than 10000.
Consider the following statements:
Example 5
data high medium low;
SET work.temp;
if GNPNEW=�high?then output high;
else if GNPNEW=�med?then output medium;
else output low;
run;
The IF-THEN statements draw subsets from the data set by the GNPNEW variable. Use the following statements, we can print the most recently created data set. What is it?
Example 6
PROC PRINT;

RUN;
If we just want to print the data set HIGH, we apply:
Example 7
PROC PRINT data=high;

RUN;
libname sasdata.prog1 'c:\sasprog';

data ch

   set sasdata.students

   if index(upcase(address),'CHAPEL HILL')>0;

proc print data=ch;

   var name address;

run;
When using list input, SAS scans the input line for values instead of reading from specific columns. Features of list input include:
. Order of the variables in the INPUT statement and their corresponding values in the data must be the same; values cannot be selectively read with list input.
. Values must be separated by at least one blank.
. Missing values must be represented by periods, not blanks.
. Numerical values cannot contain embedded blanks.
. Character values longer than eight characters must use a format-modifier statement.
The syntax for list input is:
Example 8
INPUT variable [$] [&] ... ;
where:
variable is the variable name for the data value to be read.
$ indicates that the variable has character values.
& indicates that a character value may have one or more single embedded blanks.
An informat can be specified following a variable on the INPUT statement. The informat defines the variable's data type and field width, and how the values are to be read. An informat takes the form [$][name][w].[d], where $ indicates a character informat, w is the number of columns in the input data, and d gives the number of decimal places to be assigned to values without an explicit decimal point.
The syntax for using informats is:
Example 9
INPUT variable informat ... ;
where:
variable is the variable name for the data value to be read
informat gives the informat to use when reading the data value.
Data set options can be specified whenever a SAS data set is specified. Some options can be specified as statements in a DATA step. These same options can be used following a specified data set in a SET, MERGE, or PROC statement. In this case, the data set options must be enclosed in parentheses and must immediately follow the data set to which they apply. The following are some commonly used data set options:
DROP
= variables drops the listed variables from the data set being created.The MERGE statement joins corresponding observations from two or more SAS data sets into single observations in a new SAS data set. You can merge data sets with or without a BY statement. Without a BY statement, MERGE performs one-to-one merging by joining the first observation in one data set with the first observation in another, the second observation in one data set with the second observation in another, and so on. With a BY statement, MERGE performs match-merging by joining observations from two or more sorted data sets, based on the values of the common BY variables. The syntax for the MERGE statement is:
Example 10
MERGE datasets [(options)] ;

[BY variables ;]
where:
datasets are two or more existing SAS data sets.
[(options)] are data-set options, enclosed in parentheses.
[BY variables ;] are the matching variables for the BY statement.
Each data set must be sorted by these variables. SAS functions are routines that return values computed from one or more arguments; they are used to create new variables or modify existing ones. Functions are used in statements that have the syntax:
Example 11
variable = function(arguments) ;
where:
variable is the name of the variable being created or modified.
function is the name of the function you want to use.
arguments are one or more variable names, constants, or expressions.
Commonly Used Functions
MAX returns the largest of the argument values
MIN returns the smallest of the argument values
SQRT calculates square root of the argument value
ROUND rounds value to the nearest indicated round-off unit
LOG gives the natural log of the argument
MEAN returns the mean of the nonmissing argument values
SUM returns the sum of the nonmissing argument values
STD returns the standard deviation of the nonmissing values
DATE gives the current date as a SAS date value
Conditional IF statements, with a THEN clause, execute SAS statements for those observations that meet the condition defined in the IF clause. An optional ELSE statement executes alternative statements if the THEN clause is not executed. In the syntax of each IF statement:
expression is any valid SAS expression.
statement is any executable statement or DO group.
The expression can use the following comparison operators, as well as arithmetic
operators:
EQ equal to NE not equal to
GT greater than GE greater than or equal to
LT less than LE less than or equal to
Use the IF statement when you want to execute a SAS statement for some but not all of the observations in the data set being created. The expression following the IF is evaluated; if it is true, then the statement following the THEN is executed. Syntax:
IF expression THEN statement ;
Use the IF-THEN/ELSE statements when you want to conditionally process all the observations in the data set being created. When the expression following the IF is true, the statement following the THEN is executed and the statement following the ELSE is ignored. When the expression is false, the statement following the ELSE is executed and the statement following the THEN is ignored. Syntax:
IF expression THEN statement ;
ELSE [IF] statement ;
Use the subsetting IF statement to select only those observations from the input data set that meet the IF condition. Therefore, the resulting data set contains a subset of the original observations. Syntax:
IF expression ;
In this case, SAS interprets the lack of a then-statement to mean "then include this observation in the data set".
Using Array
| Array is an alias used to represent a set of variables to be process in a like manner |
General form of the ARRAY statement:
ARRAY array-name{dimension} $ length elements (initial values);
Example 12:
data quarter;

   set sasdata.donate;

   array contrib{4} qtr1-qtr4;

   meancon=mean(of qtr1-qtr4);

   array differ{3} diff1-diff3;

   do i=1 to 3;

      differ{i}=contrib{i+1}-contrib{i};

   end;

   meandiff=mean(of diff1-diff3) ;

   drop i;

run;

proc print data=quarter;

run;
Alternate method of importing data into SAS
In the SAS v 6.12, support data files formats include dBASE files and Lotus 1-2-3 and MS Excel spreadsheets. Using the Import Wizard, the user will be guided to create a data set from files in these formats. To import files, click on File on the menu and select import as in the following:
The Import Wizard will guide you through the importation process.
Library
| A SAS data library is a collection of SAS files that are recognized as a unit by the SAS system. |
A SAS library is like a special SAS pointer to a location where your SAS files are stored. Once a library is created, SAS has access to the files in that library. When you delete a library, the files are still on your computer, but SAS no longer has access to them. By creating a library, you are essentially giving SAS a shortcut name or pointer to a storage location in your operating environment where you store SAS files.
To create a library, use the following statement:
LIBNAME libref 'path:directory';
libref is the library reference name assigned by the programmer. It is bound by the
conventional eight character, no punctuation rule.
External Files
The most common type of data is sometimes referred to as an External File, Raw File, or even a Text File. These files have the same characteristics: they are made up of numbers and/or characters and they can be processed by other programming languages as well as SAS. There are two ways to incorporate this kind of file into a SAS program. The first and the commonly used one is to put data after a CARDS command as in the previous example. Another method is to refer to the location of data in the SAS program. The latter method is more efficient than the former, because it reduces the size of your SAS program to a more manageable level, especially, when your data set has over a thousand observations. The following SAS program shows you how to accomplish the latter method.
Example 13:
FILENAME DATAIN 'A:\COUNTRY.DAT';
DATA COUNTRY;
	INFILE DATAIN;
        INPUT DEC 1 ID 2-4 NAME $CHAR26. SSCODE 31-33
              CONTIN $ 34-35 DODEV 36 POPULATE 37-43
              AREA 44-49 GNP 50-56 MILEXPED 57-64 .1
              PEDEXPED 65-71 .1;
PROC PRINT DATA=COUNTRY;
RUN;
The FILENAME statement tells SAS to use DATAIN as a file reference for the data set named 'COUNTRY.DAT'. The INFILE command tells SAS to get the data file on drive A: under 'COUNTRY.DAT'.
In the SAS v 7, support data files formats include dBASE files and Lotus 1-2-3 and Microsoft Excel 97 spreadsheets and Microsoft Access Tables. Using the Import Wizard, the user will be guided to create a data set from files in these formats. To import files, click on File on the menu and select import as in the following:
The Import Wizard will guide you through the importation process.
SAS uses a special data format during data processing. This unique data format is called a SAS data or system File. If the data file you tell SAS to use is not a SAS File, SAS converts it to a SAS File before SAS starts processing the data set. SAS Files have special characteristics that make them more convenient and efficient for SAS to use. There are two types of SAS files: SAS Data Sets (*.sd2) and SAS Catalogs (*.sc2). The most commonly used is the SAS Data Set. In a SAS Data Set, variable names, variable labels, and variable formats have been recorded together with the variable values.
A SAS File name is somewhat different from other types of data file names. A complete SAS file name consists of two parts separated by a period, for example PROJECT1.FITNESS. The first part is called the first-level name or libref, identifying the directory or library where the file is saved. The second part, the second-level name identifies the specific file name in the directory or library. Anyone can create a SAS Data Set from a regular file. The following example 5 shows how to do this.
Example 14:
TITLE 'SAS SAMPLE - COUNTRY DATA';
LIBNAME PROJECT1 'A:\MYDATA';
DATA PROJECT1.COUNTRY;
    ARRAY MISSING GNP MILEXPED PEDEXPED;
    infile 'a:\country.dat';
    input dec 1 id 2-4 name $char26. sscode 31-33
          contin $ 34-35 dodev 36 populate 37-43
          area 44-49 gnp 50-56 milexped 57-64 .1
          pedexped 65-71 .1;
    label name   = "COUNTRYS' NAME"
             CONTIN  = 'CONTINENT'
             DODEV   = 'DEGREE OF DEVELOPMENT'
             GNP     = 'GNP IN MILLIONS OF DOLLARS'
             MILEXPED= 'MILITARY EXPENDITURE IN MILLIONS OF $'
             PEDEXPED= 'PUB. EDUCATION EXPENDITURE IN MIL. $';
    DO OVER MISSING;
       IF MISSING= 9999999 OR MISSING = 999999.9 OR
       MISSING=99999.9 THEN MISSING=.;
    END;
RUN;
PROC PRINT DATA=COUNTRY;
RUN;
The LIBNAME directs SAS to associate PROJECT1 with the directory A:\MYDATA. After this job has been executed, you will have a SAS Data Set saved under A:\MYDATA\COUNTRY.SD2. Retrieving a SAS Data Set is easy because you do not have to tell SAS the variable names, variable formats, variable label, and variable locations. The example below shows you how this can be done.
Example 15:
LIBNAME PROJECT1 'A:\MYDATA';
DATA;
  SET PROJECT1.COUNTRY;
PROC PRINT;
RUN;
In a SAS for Windows session, you can have as many SAS data steps as you want. You can use the LIBNAME command as often as you need to direct SAS for Windows to different SAS data directories. In case you have many SAS data files in a SAS program, SAS for Windows allows you to keep track of your SAS data files and their variables.
SAS for Windows has LIBNAME, DIRECTORY, and VARIABLES windows. The LIBNAME window tells you how many SAS data libraries are in a SAS program. The DIRECTORY window displays how many SAS data files are in a SAS data library or directory. The VARIABLES window lists the SAS variables in each SAS data file. To tell SAS for Windows to go to the LIBNAME window, you type LIB at the command box. A list of libraries or directories will be shown on a new window (LIB Window). You can tab down to the directory that you want to inspect. Then you mark it by typing S in front of the directory name and press <ENTER>. A list of SAS data files will be displayed in a new window (DIR window). If you want to look at the variables in a SAS data file, you tab the cursor to that file and then mark that file and hit <ENTER>. You will see a list of variables in that file in a new window (VAR window).
You can also go to the DIR and VAR windows directly by typing DIR and VAR respectively at the command prompt in any SAS for Windows display Manager window. By doing this, SAS for Windows displays the current directory which is the WORK directory. To tell SAS for Windows to display the desired directory, you can type the name of the directory at the top of the window. You can do the same with the VAR window.
A PROCedure step calls a SAS procedure to analyze or process a SAS dataset. The PROC step begins with a PROC statement and ends with a RUN statement. All of the statistical procedures require the input of a SAS data set. This data set should have already been prepared in a DATA step for processing by the procedure, since SAS procedures allow only limited adjustment of the data set.
The general syntax for a PROC step is:
PROC name [DATA=dataset [dsoptions] ] [options];

[other PROC-specific statements;]

[BY varlist;]

RUN;
where:
name |
identifies the procedure you want to use. |
dataset |
identifies the SAS data set to be used by the procedure; if omitted, the last data set to have been created during the session is used. |
dsoptions |
specifies the data set options to be used. |
varlist |
specifies the variables that define the groups to be processed separately. The data set must already be sorted by these same variables. |
options |
specifies the PROC-specific options to be used. |
The syntax above uses the following conventions for statements:
. SAS keywords are in UPPERCASE;
. User-supplied words (such as file names or variable names) are in lowercase;
. Options are in brackets [ ] . Note that you do not type the brackets.
This is a simplified form of the syntax conventions used in SAS manuals and in documentation for most statistical packages.
A SAS program can contain any number of DATA and PROC steps. The SAS statements in each step are executed all together. Once a dataset has been created, it can be processed by any subsequent DATA or PROC step. Note the following rules of the SAS statements:
- All SAS statements start with a keyword (DATA, INPUT, PROC, etc.)
- All SAS statements end with a semicolon (;) . (The most common problem students encounter is omitting a semicolon -- SAS thinks that two statements are just one.)
- SAS statements can be entered in free-format : You can begin in any column, type several statements on one line or split a single statement over several lines (as long as no word is split.).
- Uppercase and lowercase are equivalent, except inside quote marks ( sex = 'm'; is not the same as sex = 'M';).
SAS Procedures exist to carry out all the forms of statistical analysis. As the above examples indicate, a procedure is invoked in a "PROC step" which starts with the keyword PROC, such as:
PROC MEANS DATA=CLASS;
VAR HEIGHT WEIGHT;
The VAR or VARIABLES statement can be used with all procedures to indicate which variables are to be analyzed. If this statement is omitted, the default is to include all variables of the appropriate type (character or numeric) for the given analysis.
Some other statements that can be used with most SAS procedure steps are:
BY variable(s);
Causes the procedure to be repeated automatically for each different value of the named variable(s). The data set must first be sorted by those variables.
ID variable(s);
Give the name of a variable to be used as an observation IDentifier.
LABEL var='label';
Assign a descriptive label to a variable.
WHERE (expression);
Select only those observations for which the expression is true.
For example, the following lines produce separate means for males and females, with the variable SEX labeled 'Gender'. (An ID statement is not appropriate, because PROC MEANS produces only summary output.)
PROC SORT DATA=CLASS;
BY SEX;
PROC MEANS DATA=CLASS;
VAR HEIGHT WEIGHT;
BY SEX;
LABEL SEX='Gender';
If the DATA= option is not used, SAS procedures process the most recently created dataset. In the brief summaries below, the required portions of a PROC step are shown in bold. Only a few representative options are shown.
The following covers some of the most commonly used SAS procedures with which you can run some basic statistical analyses.
1. PROC PRINT
PROC PRINT is frequently used to check the data being read by SAS. It prints out
the observations in a SAS data set, using any or some of the variables.
The syntax is as follows:
PROC PRINT DATA= SAS-data-set

DOUBLE

NOOBS

UNIFORM

LABEL

SPLIT= 'split-character'

N

ROUND

HEADING= direction

ROWS= page-format

WIDTH= column-width;

VAR variable-list;

ID variable-list;

BY variable-list;

PAGEBY BY-variable;

SUMBY BY-variable;

SUM variable-list;
The most common use is to have the PROC PRINT following the data step to verify the data:
DATA;

INPUT X Y;

CARDS;

1 2

3 4

5 7

;

PROC PRINT;

RUN;
2. PROC CONTENTS
This procedure prints descriptions of the contents of one or more files from a SAS
library. Another common procedure to verify the data set read into SAS library,
especially for a sizeable data set. It is crucial, for example, to check if all
observations and variables are read in correctly. PROC CONTENTS prints descriptions
of the contents of one or more files from a SAS data library. It is useful for documenting
permanent SAS data sets (library members of DATA type).
Specific information pertaining to the physical characteristics of a member depends on
whether the file is a SAS data set or another type of SAS file.
Syntax:
PROC CONTENTS <DATA= <libref.>member>

<DIRECTORY>

<FMTLEN>

<MEMTYPE= (mtype-list)>

<NODS>

<NOPRINT>

<OUT= SAS-data-set>

<POSITION>

<SHORT>

<DETAILS|NODETAILS>;
3. PROC UNIVARIATE
This procedure is useful for basic descriptives of the variables. It provides
detail on the distribution of a variable. Features include:
?nbsp; detail on the extreme values of a variable
?nbsp; quartiles, such as the median
?nbsp; several plots to picture the distribution
?nbsp; frequency tables
?nbsp; a test to determine that the data are normally distributed.
If a BY statement is used, descriptive statistics are calculated separately for groups of
observations.
Syntax:
PROC UNIVARIATE DATA= SASdataset

NOPRINT

PLOT

FREQ

NORMAL

PCTLDEF= value

VARDEF= DF|WEIGHT|WGT|N|WDF

ROUND= roundoff unit...;

VAR variables;

BY variables;

FREQ variable;

WEIGHT variable;

ID variables;

OUTPUT OUT= SASdataset keyword= names...;
4. PROC FREQ
The procedure produces one-way to n-way frequency and crosstabulation tables. It
shows the distribution of variable values and crosstabulation tables with combined
frequency distributions for two or more variables. For one-way tables, PROC FREQ can
compute chi-square tests for equal or specified proportions. For two-way tables, PROC FREQ
computes tests and measures of association. For n-way tables, PROC FREQ does stratified
analysis, computing statistics within as well as across strata.
Syntax:
PROC FREQ options;

OUTPUT <OUT= SAS-data-set><output-statistic-list>;

TABLES requests / options;

WEIGHT variable;

EXACT statistic-keywords;

BY variable-list;
5. PROC TABULATE
PROC TABULATE constructs tables of descriptive statistics using class variables,
analysis variables, and keywords for statistics. Tables can have one to three dimensions:
column; row and column; or page, row, and column.
The statistics that PROC TABULATE computes are many of the same statistics computed by
other descriptive procedures such as MEANS, FREQ, and SUMMARY. In order for PROC TABULATE
to execute, you need either a CLASS or VAR statement, and a TABLE statement. There are no
default variables chosen for the procedure.
Syntax:
PROC TABULATE <option-list>;

CLASS class-variable-list;

VAR analysis-variable-list;

FREQ variable;

WEIGHT variable;

FORMAT variable-list-1 format-1 <...variable-list-n format-n>;

LABEL variable-1='label-1' <...variable-n='label-n'>;

BY <NOTSORTED> <DESCENDING> variable-1

<...<DESCENDING> VARIABLE-N>;

TABLE <<page_expression,> row_expression,> column_expression

</ table-option-list>;

KEYLABEL keyword-1 ='description-1'

<...keyword-n='description-n'>;
6. PROC MEANS
PROC MEANS computes statistics for an entire SAS data set or for groups of observations in the data set. If you use a BY statement, PROC MEANS calculates descriptive statistics separately for groups of observations. Each group is composed of observations having the same values of the variables used in the BY statement. The groups can be further subdivided by the use of the CLASS statement. PROC MEANS can optionally create one or more SAS data sets containing the statistics calculated.
PROC MEANS is the easiest and most direct descriptive procedure for computing univariate statistics. Other SAS procedures which compute univariate statistics and provide additional features are CHART, TABULATE, and UNIVARIATE.
The full syntax for PROC MEANS is as follows:
PROC MEANS <option-list> <statistic-keyword-list>;
VAR variable-list;
BY variable-list;
CLASS variable-list;
FREQ variable;
WEIGHT variable;
ID variable-list;
OUTPUT <OUT= SAS-data-set> <output-statistic-list>
<MINID|MAXID <(var-1<(id-list-1)>
<...var-n<(id-list-n)>>)>=name-list>;
7. PROC REG
PROC REG is a general-purpose procedure for regression, while other regression procedures in the SAS System implement more specialized applications. PROC REG provides nine model-selection methods, tests linear hypotheses and multivariate hypotheses, generates scatter plots of data and various statistics, computes collinearity diagnostics and influence statistics, produces partial leverage plots, and outputs statistics to a SAS data set, including predicted values, residuals, ridge regression estimates and confidence limits. PROC REG fits linear regression models by least-squares estimation. Subsets of independent variables that "best" predict the dependent or response variable can be determined by various model-selection methods. PROC REG can be used interactively.
The full syntax for PROC REG is as follows:
PROC REG options;
label: MODEL dependents= regressors / <options>;
BY variable-list;
FREQ variable;
ID variable;
VAR variable-list;
ADD variable-list;
DELETE variable-list;
REWEIGHT <condition|ALLOBS> </options> | <STATUS|UNDO>;
WEIGHT variable;
label: MTEST <equation1, ... equationk / options>;
OUTPUT OUT= SAS-data-set keyword= names ...;
PAINT <condition|ALLOBS> </options> | <STATUS|UNDO>;
PLOT <yvariable1*xvariable1> <=symbol1>,...
<yvariablek*xvariablek> <=symbolk> </options>;
PRINT <options ANOVA MODELDATA>;
REFIT;
RESTRICT equation1, ... equationk;
label: TEST equation1, ... equationk / option;
8. PROC ARIMA
The ARIMA procedure implements a flexible and powerful method to analyze and forecast time series data. PROC ARIMA's implementation is similar to that of programs 1-7 in Part V of Box and Jenkins (1976). PROC ARIMA can handle time series of moderate size; there should be more than 30 observations and less than 2000. You should consider other procedures, such as FORECAST or AUTOREG, if PROC ARIMA does not meet your needs.
PROC ARIMA models a value in a response time series as a linear combination of its own past values, past errors (shocks, innovations), and past values of other time series.
The full syntax for PROC ARIMA is as follows:
PROC ARIMA options;
IDENTIFY VAR=variable options;
ESTIMATE options;
FORECAST options;
BY variables;
Functional Categories of Base SAS Procedures
| Report Writing |
| CALENDAR | MEANS* | SQL* |
| CHART* | PLOT | SUMMARY* |
| FORMS | TABULATE* | |
| FREQ* | REPORT* | TIMEPLOT |
| *These procedures produce reports and compute statistics. | ||
| Statistics |
| CHART | RANK | SUMMARY |
| CORR | REPORT | TABULATE |
| FREQ | SQL | UNIVARIATE |
| MEANS | STANDARD |
| Utilities |
| APPEND | EXPLODE | REGISTRY |
| BMDP** | EXPORT | RELEASE** |
| CATALOG | FORMAT | SORT |
| CIMPORT | FSLIST | SOURCE** |
| COMPARE | IMPORT | SQL |
| CONTENTS | OPTIONS | TAPECOPY** |
| CONVERT** | PDS** | TAPELABEL** |
| COPY | PDSCOPY** | TRANSPOSE |
| CPORT | PMENU | TRANTAB |
| DATASETS | PRINTTO | |
| **See the SAS documentation for the operating environment for a description of these procedures. | ||
IV. Examples
PROC CORR
Correlations among a set of variables.
PROC CORR DATA=SASdataset options;
options:NOMISS ALPHA
VAR variable(s);
WITH variable(s);
where nomiss option excludes missing values and ALPHA specifies Pearson Correlations with Cronbach’s alpha.
Example
To get the correlation coefficients fro HEIGHT and WEIGHT, use the VAR statement:
PROC CORR;
VAR HEIGHT WEIGHT;
The output should look like:
    ---------------------------------------------------------------------
                                          CUMULATIVE    CUMULATIVE
      AGE    FREQUENCY    PERCENT         FREQUENCY     PERCENT

      11         2          10.5              2            10.5
      12         5          26.3              7            36.8
      13         3          15.8              10           52.6
      14         4          21.1              14           73.7
      15         4          21.1              18           94.7
      16         1           5.3              19           100.0
    ---------------------------------------------------------------------
PROC FREQ
Frequency tables, chi ?tests
PROC FREQ DATA=SASdataset;
TABLES variable(s) / options;
options:NOCOL NOROW NOPERCENT
OUTPUT OUT=SASdataset;
Example
To get the frequency of AGE in Data Class.
PROC FREQ DATA=CLASS;
TABLES AGE;
Then output should look like:
    ---------------------------------------------------------------------
                                          CUMULATIVE    CUMULATIVE
      AGE    FREQUENCY    PERCENT         FREQUENCY     PERCENT

      11         2          10.5              2            10.5
      12         5          26.3              7            36.8
      13         3          15.8              10           52.6
      14         4          21.1              14           73.7
      15         4          21.1              18           94.7
      16         1           5.3              19           100.0
    ---------------------------------------------------------------------
Also, you can get the crosstab table for two variables. For example, if you want to examine the
relationship between AGE and HEIGHT, you can use the Frequency procedure get the cross table for them.
PROC FREQ DATA=CLASS;
TABLES AGE*HEIGHT;
PROC MEANS
Means, standard deviations, and a host of other univariate statistics for a set of variables.
PROC MEANS DATA=SASdataset options;
options:N MEAN STD MIN MAX SUM VAR CSS USS
VAR variable(s);
BY variable(s);
OUTPUT OUT=SASdataset keyword=variablename ... ;
Statistical options on the PROC MEANS statement determine which statistics are printed. The (optional) OUTPUT statement is used to create a SAS dataset containing the values of these statistics.
Example
You can examine the means of WEIGHT for different SEX.
PROC MEANS;
BY SEX;
VAR WEIGHT;
The output should look like:
    -----------------------------------------------------------------
    VARIABLE  N      MEAN         STD         MINIMUM    MAXIMUM

    -------------------------SEX=F-----------------------------------
     WEIGHT   9   89.88888889   19.41934888   50.000000   112.000000
    -------------------------SEX=M-----------------------------------
     WEIGHT  10   108.8000000   22.75863694   83.000000   150.000000
    -----------------------------------------------------------------
PROC UNIVARIATE
Univariate statistics and displays for a set of variables.
PROC UNIVARIATE DATA=SASdataset options;
options:PLOT
VAR variable(s);
BY variable(s);
OUTPUT OUT=SASdataset keyword=variablename ... ;
Example
You can examine the univariate statistics like median and kurtosis of WEIGHT for different SEX.
PROC UNIVARIATE DATA=class PLOT;
VAR weight;
BY sex ;
run;
Click here to take a look at the output.
SAS statements and options for regression (PROC REG) are described in more detail in the document PROC REG Summary. SAS statements and options for analysis of variance (PROC ANOVA and PROC GLM) described in the document PROC ANOVA and PROC GLM.
PROC ANOVA
Analysis of variance (balanced designs)
PROC ANOVA DATA=SASdataset options;
CLASS variable(s);
MODEL dependent(s)= effect(s);
PROC GLM
General linear models, including ANOVA, regression and analysis of covariance models.
PROC GLM DATA=SASdataset options;
CLASS variable(s);
MODEL dependent(s)= effect(s);
OUTPUT OUT=SASdataset keyword=variablename ... ;
PROC REG
Regression analysis
PROC REG DATA=SASdataset options;
MODEL dependent(s) = regressors
/ options;
PLOT variable | keyword. *
variable | keyword. = symbol ;
OUTPUT OUT=SASdataset P=name R=name ... ;
PROC CHART
Histograms and bar charts
PROC CHART DATA=SASdataset options;
VBAR variable / options;
HBAR variable / options;
options: MIDPOINTS= GROUP= SUMVAR=
PROC PLOT
Scatter plots
PROC PLOT DATA=SASdataset options;
options: HPERCENT= VPERCENT=
PLOT yvariable *
xvariable = symbol / options;
PLOT (yvariables) *
(xvariables) = symbol / options ;
PLOT options: BOX OVERLAY VREF= HREF=
BY variable(s) ;
Note that the parenthesized form in the PLOT statement plots each y-variable listed against each x-variable.
PROC PRINT
Print a SAS data set
PROC PRINT DATA= SASdataset options;
options: UNIFORM LABEL SPLIT='char'
VAR variable(s);
BY variable(s);
SUM variable(s);
PROC SORT
Sort a SAS data set according to one or more variables.
PROC SORT DATA=SASdataset options;
options: OUT=
BY variable(s);
Last updated: 01/18/06 by Karl Ho