

Computer Tools for Research and Data Analysis
Creation date: 2/25/99
Author: Karl Ho
Objectives: This course is to introduce the fundamentals of using computer for research and familiarize researchers with the computing environment at the University of North Texas. Its Objectives include:
1. Understanding the Data Preparation Process;
2. Managing Data Sets for Analysis;
3. Performing Exploratory Data Analysis
Topics:
1. Introduction
This course focuses on one of the integral building blocks of the scientific research process: data. This training will cover the various topics pertaining to the gathering and management of data needed for scientific research. These comprise the collection of data, methods of storing and transferring data and exploring data as preliminary analysis. In the last session we will also illustrate how to present the data with which we can perform simple statistical analysis.
Successful research necessitates good planning on gathering the data for analysis. The very first step of planning for data collection alone can determine if the project prevails. Hence, principal investigators and researchers are required to ensure the data are collected in an appropriate manner using the right instruments, recorded error-free with the right tools and imported into statistical application with detailed documentation. In most cases, data are extracted from its original raw form (e.g. questionnaire or measuring instrument log) and recorded using computer-recognizable codes such as the ASCII alphanumeric values. These values can be typed into a word processing file or an electronic spreadsheet. Most of the present day statistical applications can read in files in these two categories of file formats. For Windows applications such as SPSS, data entry can also be done using data editor or tables built-in in the software. The most commonly used method, however, is the ASCII text file since electronic spreadsheet programs are usually bound by the amount of computer memory and, in some cases, stop short when the memory is short or out. Direct entry into data table or editor of the program also suffers from memory limits and lack of flexibility in controlling the variable formats. Using ASCII text files, users can set up programs to assign formats and control details like decimal place in a more flexible manner.
File Formats:
ASCII - American Standard Code for Information Interchange
EBCDIC - Extended Binary Coded Decimal Interchange Code (EBCDIC)
Binary
Editors:
3. Data Storage and Transferal
After collecting and recording the data in a file, you need to pay attention to the fashion you keep the files. It is ALWAYS advised to keep second and even third copies of the file and BACKUP the files somewhere other than just the floppy disk. You may also transfer the files to your computer accounts such as CMS or UNIX sol accounts so in case your computer gets burnt down or crashed, you still have a copy in a remote computer.
Different formats
SPSS system file- *.sys, *.sav
SPSS portable file - *.exp, *.por
SAS system file - *.sd2
Lotus Spreadsheet - *.wk*
Excel Spreadsheet - *.xls
ASCII/DOS text - *.dat, *.prn, *.txt
What mode/formats are they in:
*.sys - binary/ASCII
*.sav - binary/ASCII
*.exp/*.por - binary/ASCII
*.sd2 - binary/ASCII
*.dat - binary/ASCII
*.xls - binary/ASCII
*.wk* - binary/ASCII
How to store the files on a remote computer? First, you need to have a computer account. You can get the account from the Computer Center. Specify if you need a UNIX sol (confined to Faculty and Graduate students) or a mainframe CMS account. Consult your professor for the latter one.
Using FTP to transfer files
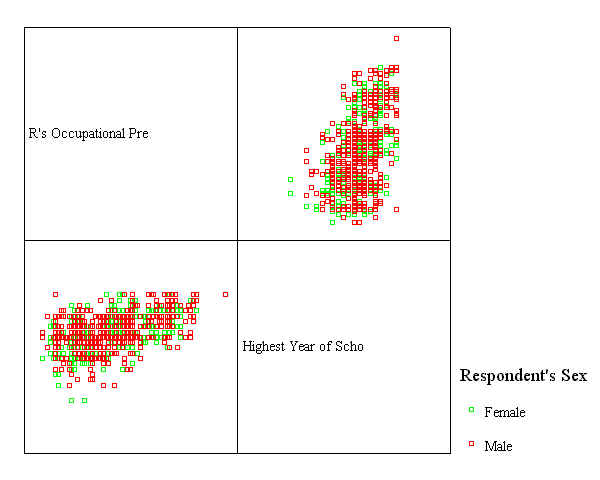
Most researchers are anxious about SEEING the data: what they look like, how they are distributed, what can be drawn from the data, etc. First of all, you can use a view table or a spreadsheet to visualize the figures and contents in a data set. Once you read in the data using a statistical application, you can also examine different dimension of the variables or plot them in univariate, bivariate and multivariate charts:
Histogram using SPSS

Matrix Scatter Plot using SPSS
Time Series Plot Using SAS

Surface Plot Using SAS

World Map using Excel

Texas GIS Map using SAS
Trellis Plot using S-Plus
Once the data are well managed and visualized, you can apply further statistical analysis to study the "data generating process" and relationships among the variables. There are two approaches in analyzing the data: using a point-and-click approach or programming approach. The former is easy to use and applicable for most beginners. For long term research projects, the latter is highly recommended since 1. more flexibility in manipulating the data; 2. some sophisticated procedures and specifications are not available from the menu; 3. replication is possible.
Software supported at UNT RSS office:
| Software/Version* | Windows | Mac | CMS | MVS | UNIX |
| SAS | 6.12/7 | 6.1 | 6.08/TS425 | 6.09/TS450 | 6.12 |
| SPSS | 8.0.1/9 | 6.1 | 4.1 | 4.1 | 6.1 |
| Eviews | 3.1 | - | - | - | - |
| LISREL | 8.2/8.3 | - | 7 | 7 | - |
| S-Plus | 4.5 | - | - | - | 5.0 |
red font - latest version
The following are a few SPSS sample programs:
T-test
T-TEST
  /TESTVAL=0
  /MISSING=ANALYSIS
  /VARIABLES=happy
  /CRITERIA=CIN (.95) .
T-Test


One-way ANOVA
ONEWAY
  happy BY educ
  /MISSING ANALYSIS .
Oneway

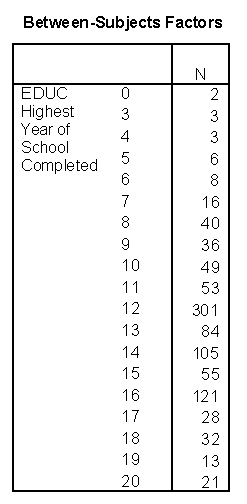
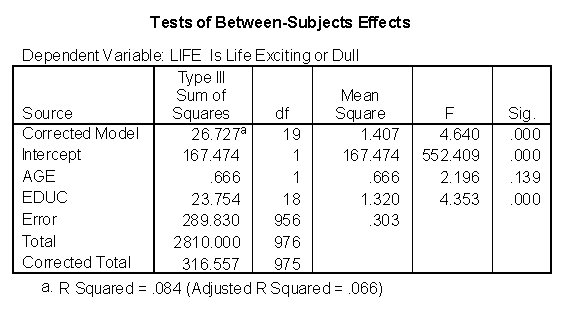
GLM - General Factorial
UNIANOVA
  life  BY educ  WITH age
  /METHOD = SSTYPE(3)
  /INTERCEPT = INCLUDE
  /CRITERIA = ALPHA(.05)
  /DESIGN = age educ .
Univariate Analysis of Variance
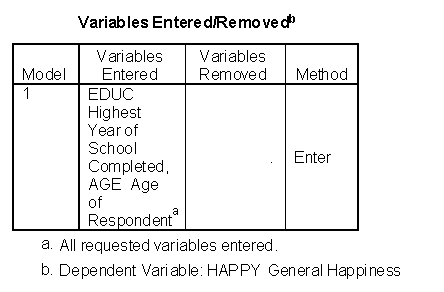
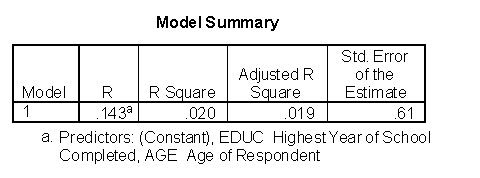
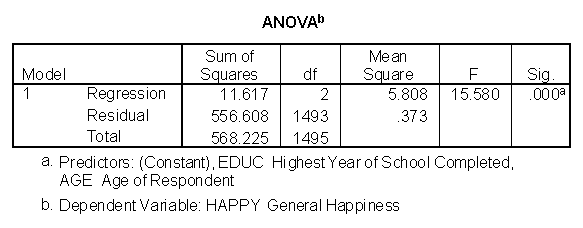
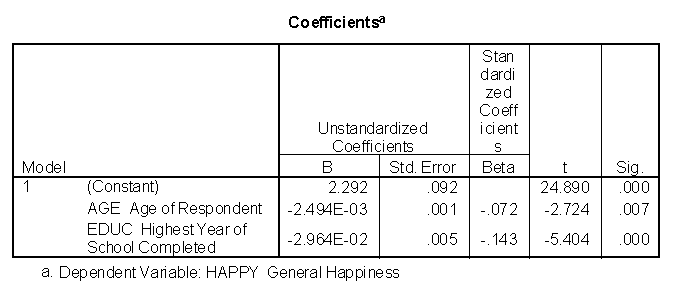
Linear Regression
REGRESSION
  /MISSING LISTWISE
  /STATISTICS COEFF OUTS R ANOVA
  /CRITERIA=PIN(.05) POUT(.10)
  /NOORIGIN
  /DEPENDENT happy
  /METHOD=ENTER age educ  .
Regression
| Application | Course Title | Time |
| Research Tools | Computer Tools for Research and Data Analysis | 3 Hours |
| SAS | Introduction to SAS | 3 Hours |
| Workshop in S-Plus Programming I | 3 Hours | |
| Workshop in S-Plus Programming II | 3 Hours | |
| Mapping Data Using SAS and Excel | 3 Hours | |
| SPSS | Introduction to SPSS | 3 Hours |
| Workshop in S-Plus Programming I | 3 Hours | |
| Workshop in S-Plus Programming II | 3 Hours | |
| S-Plus | Introduction to S-Plus | 3 Hours |
| Workshop in S-Plus Programming I | 3 Hours | |
| Workshop in S-Plus Programming II | 3 Hours |
Last updated: 01/18/06 by Karl Ho